. 2023 Jan 12;11(1):74.
doi: 10.3390/toxics11010074.

PFAS Biotransformation Pathways: A Species Comparison Study

Affiliations

PFAS Biotransformation Pathways: A Species Comparison Study

Richard C Kolanczyk et al. Toxics. .

Abstract

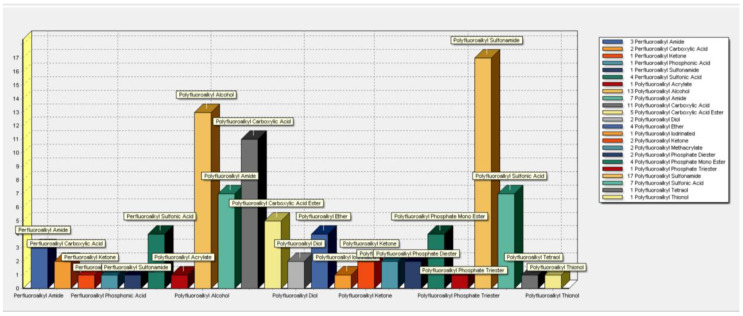
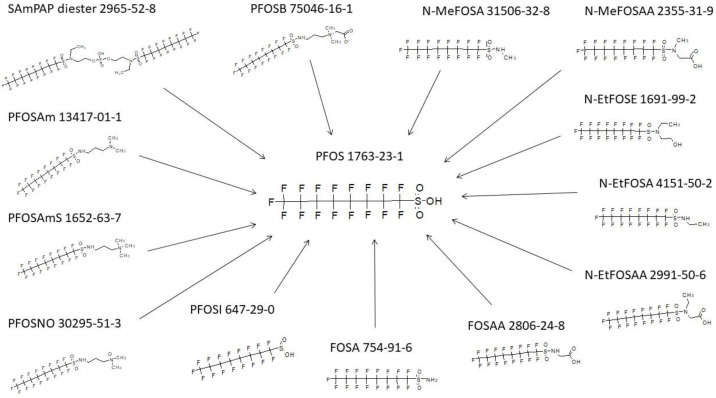
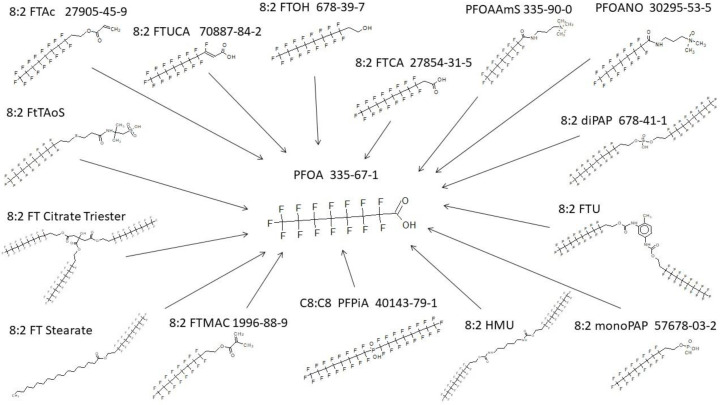
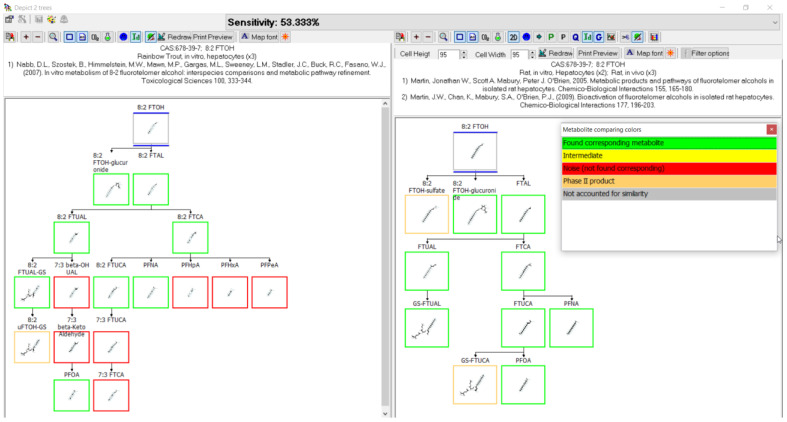
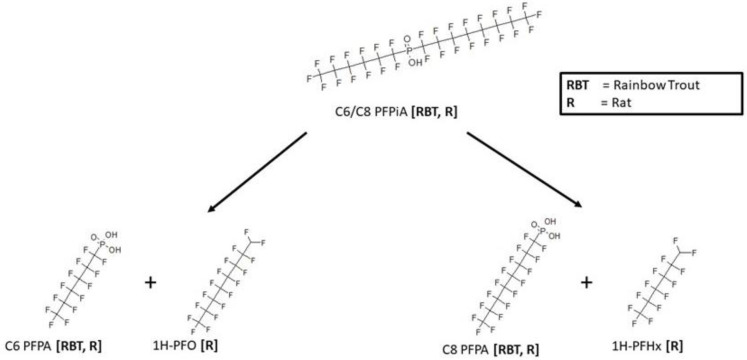
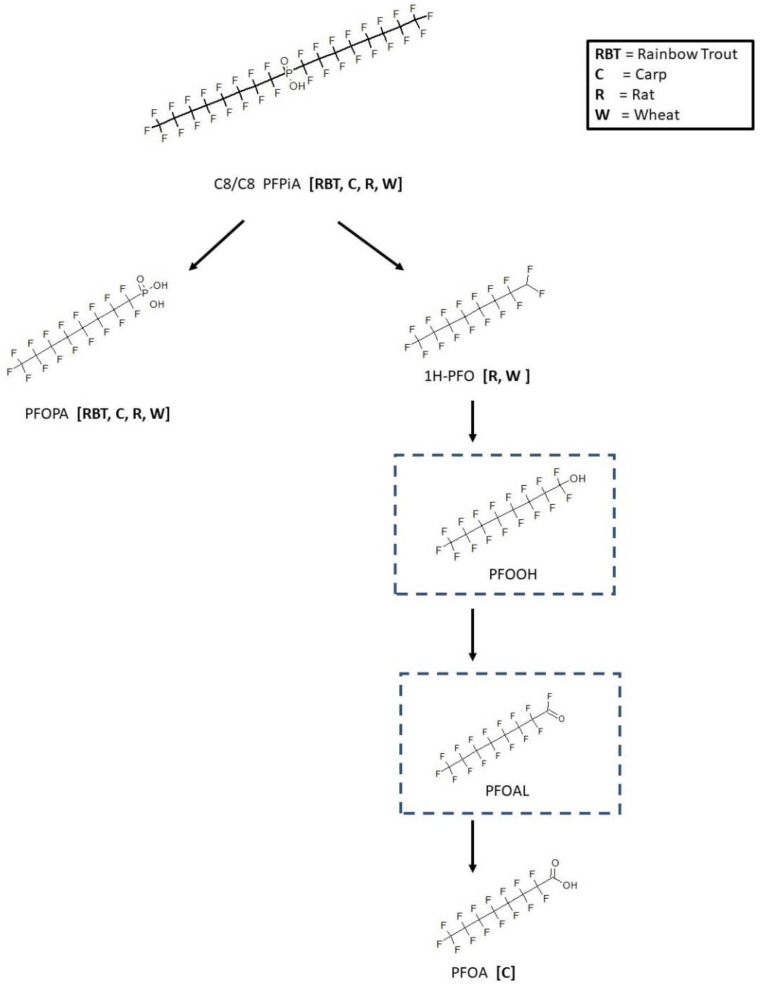
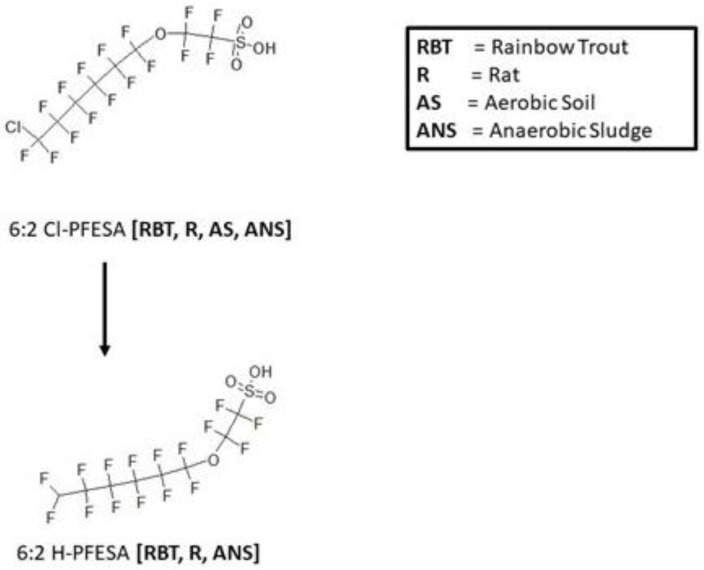
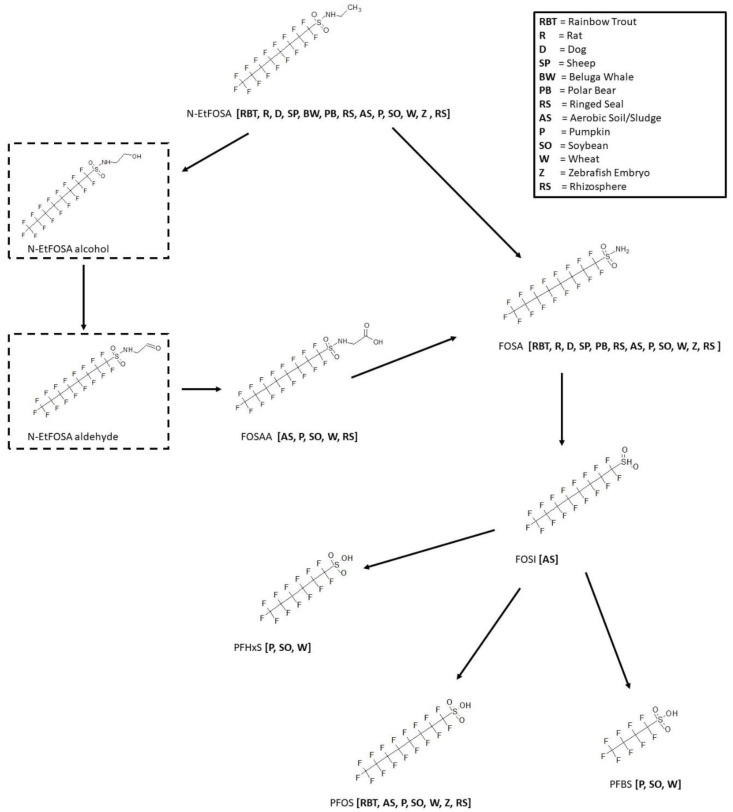
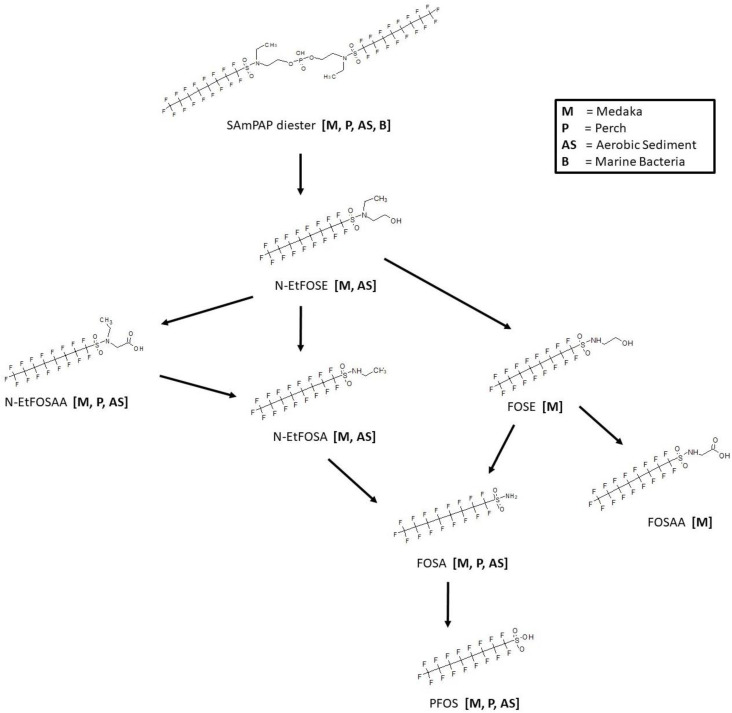
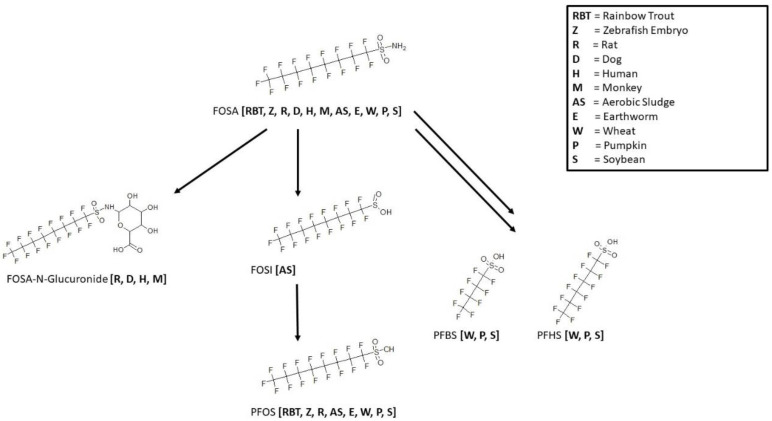
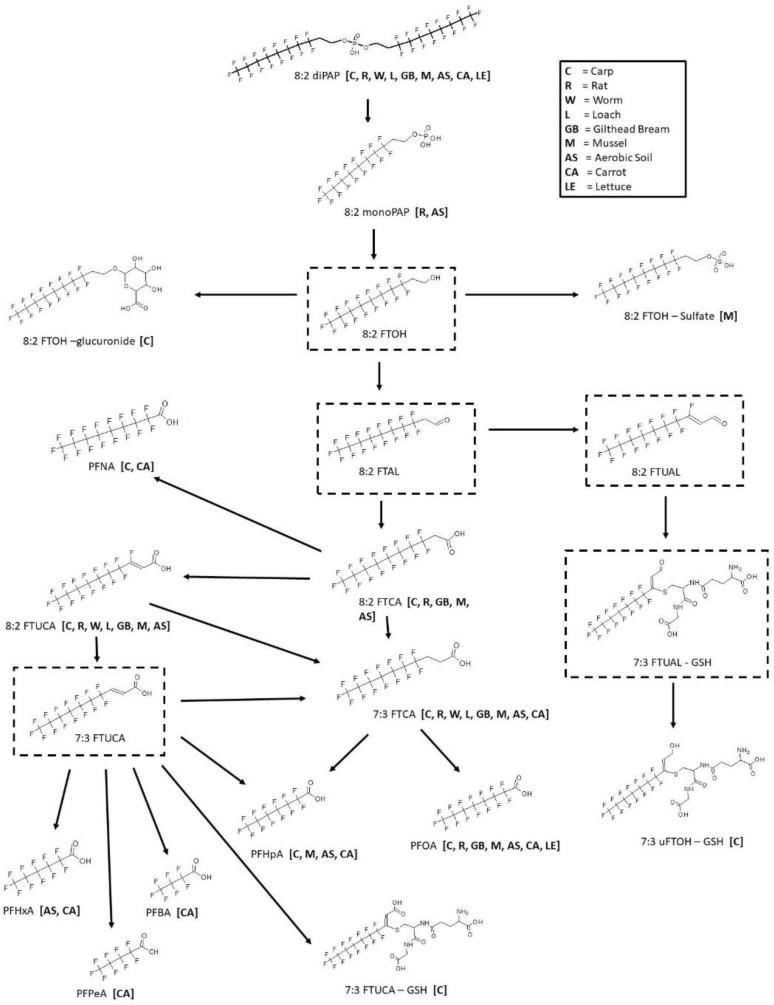
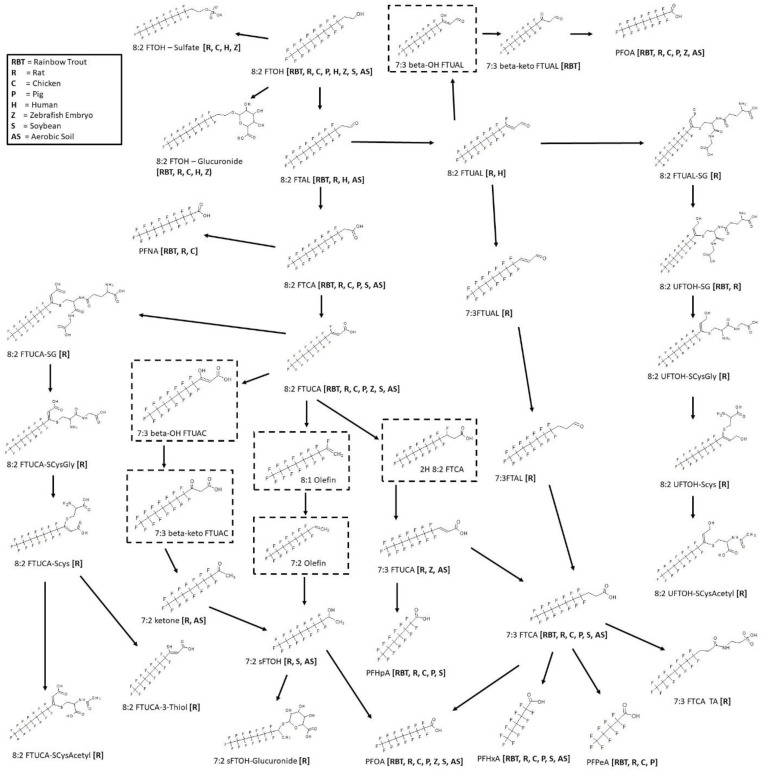
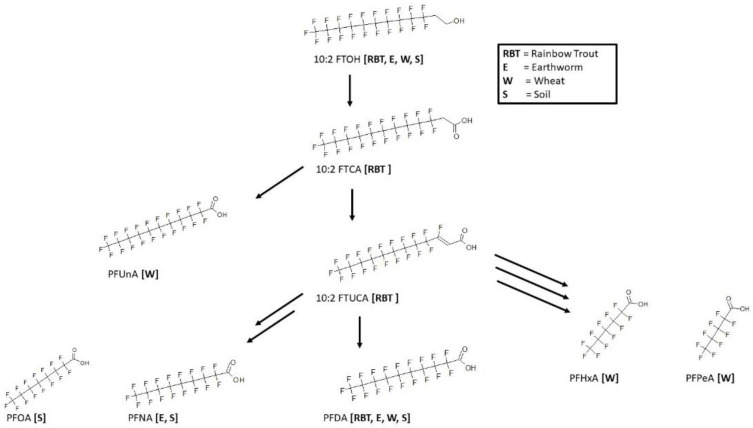
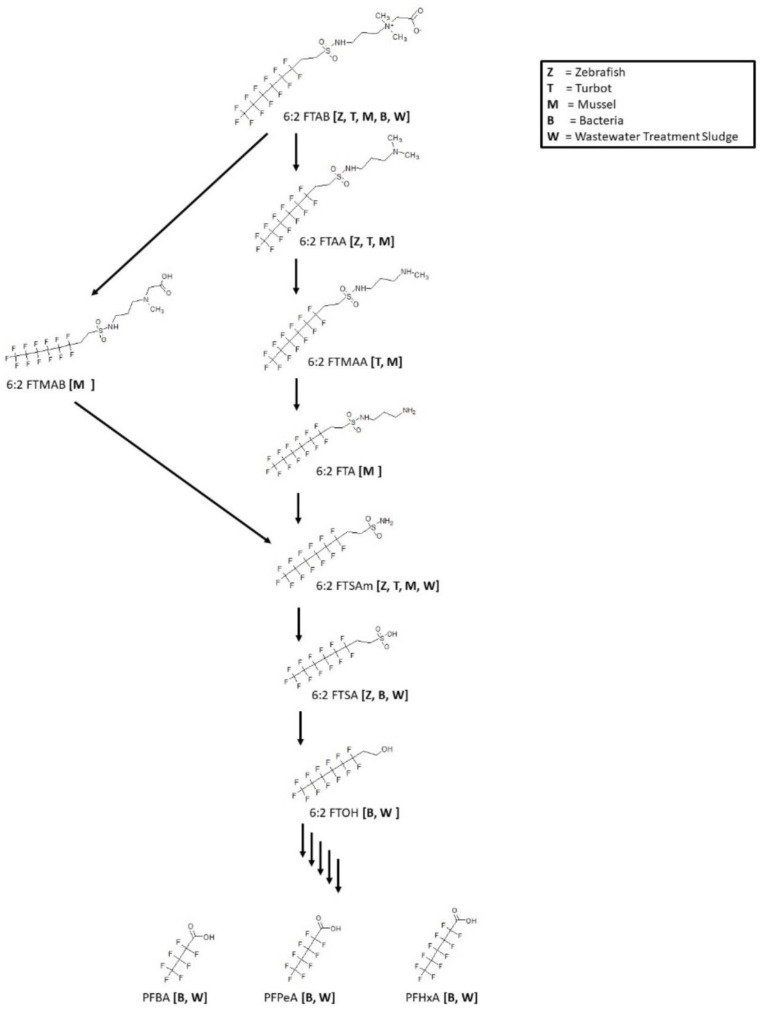
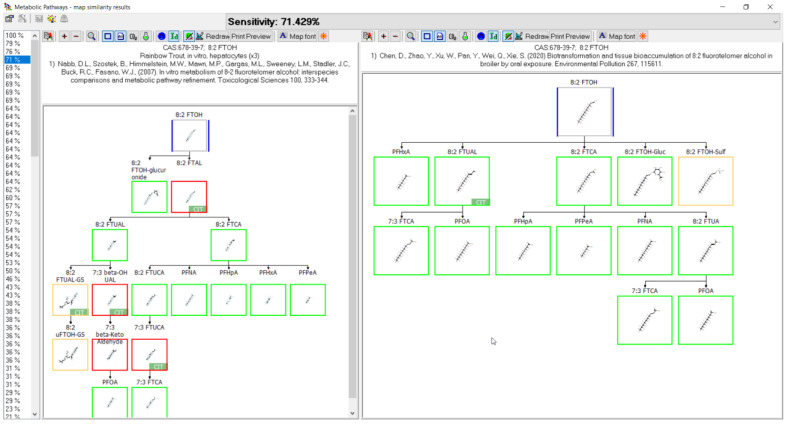
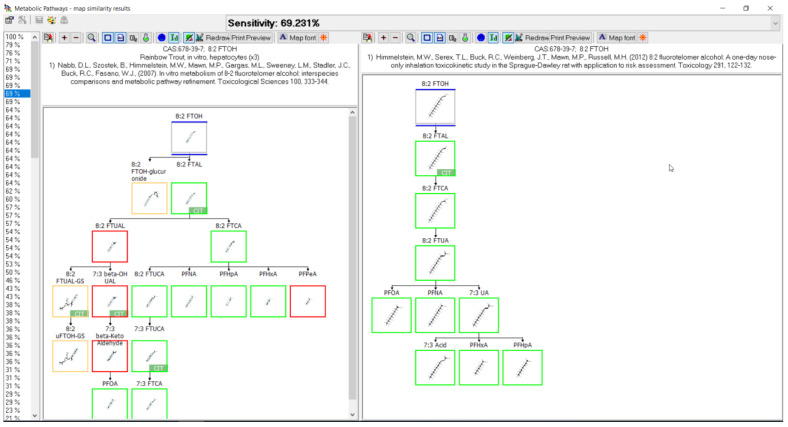
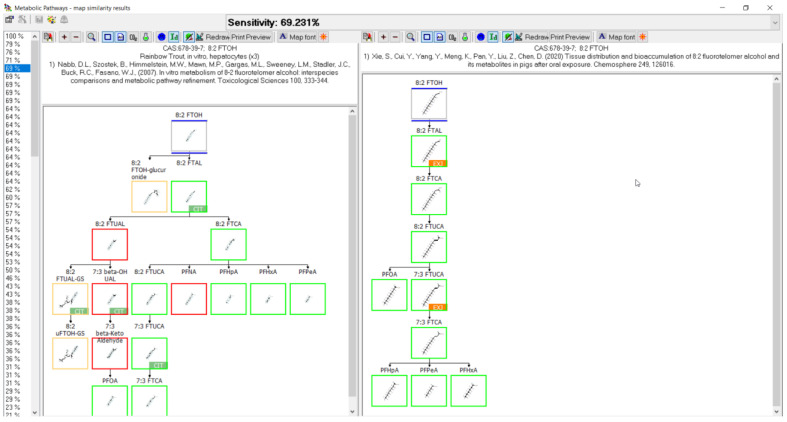
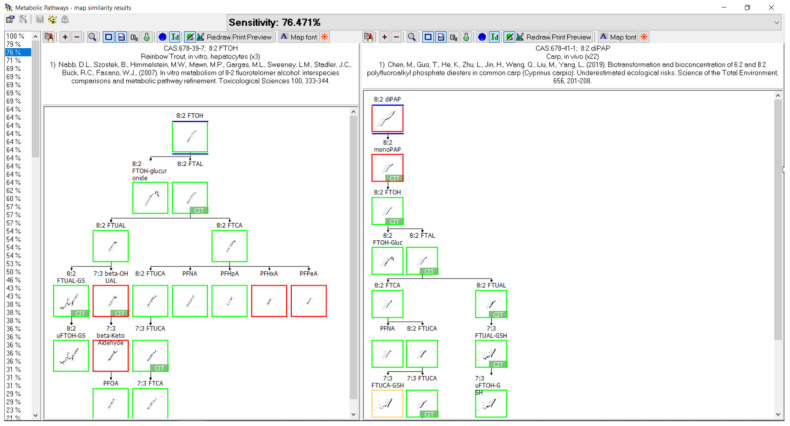
Limited availability of fish metabolic pathways for PFAS may lead to risk assessments with inherent uncertainties based only upon the parent chemical or the assumption that the biodegradation or mammalian metabolism map data will serve as an adequate surrogate. A rapid and transparent process, utilizing a recently created database of systematically collected information for fish, mammals, poultry, plant, earthworm, sediment, sludge, bacteria, and fungus using data evaluation tools in the previously described metabolism pathway software system MetaPath, is presented. The fish metabolism maps for 10 PFAS, heptadecafluorooctyl(tridecafluorohexyl)phosphinic acid (C6/C8 PFPiA), bis(perfluorooctyl)phosphinic acid (C8/C8 PFPiA), 2-[(6-chloro-1,1,2,2,3,3,4,4,5,5,6,6-dodecafluorohexyl)oxy]-1,1,2,2-tetrafluoroethanesulfonic acid (6:2 Cl-PFESA), N-Ethylperfluorooctane-1-sulfonamide (Sulfuramid; N-EtFOSA), N-Ethyl Perfluorooctane Sulfonamido Ethanol phosphate diester (SAmPAP), Perfluorooctanesulfonamide (FOSA), 8:2 Fluorotelomer phosphate diester (8:2 diPAP), 8:2 fluorotelomer alcohol (8:2 FTOH), 10:2 fluorotelomer alcohol (10:2 FTOH), and 6:2 fluorotelomer sulfonamide alkylbetaine (6:2 FTAB), were compared across multiple species and systems. The approach demonstrates how comparisons of metabolic maps across species are aided by considering the sample matrix in which metabolites were quantified for each species, differences in analytical methods used to identify metabolites in each study, and the relative amounts of metabolites quantified. Overall, the pathways appear to be well conserved across species and systems. For PFAS lacking a fish metabolism study, a composite map consisting of all available maps would serve as the best basis for metabolite prediction. This emphasizes the importance and utility of collating metabolism into a searchable database such as that created in this effort.

Keywords: MetaPath; PFAS; biodegradation; biotransformation; comparison; fish; metabolism; pathway.


Conflict of interest statement

All studies reported in this manuscript were supported by the EPA, Office of Research and Development. The authors report no declaration of interest.

Figures

Figure 1
Figure 1
Classification of 97 PFAS found in the open literature biotransformation database, utilizing the Automated PFAS Pipeline Profiler.
Figure 2
Figure 2
PFOS originating from a very diverse set of parent structures as found in the database.
Figure 3
Figure 3
PFOA originating from a very diverse set of parent structures as found in the database.
Figure 4
Figure 4
Metabolic map comparison of 8:2 FTOH in (left) rainbow trout hepatocytes and (right) rat hepatocytes. Metabolites common to both species are indicated by green boxes. Differences in metabolites are indicated by red boxes. Tan boxes indicate phase II conjugates. Sensitivity, in this case 53.333%, is an assessment of the map comparison whereby the number of common metabolites is divided by the total number of metabolites.
Figure 5
Figure 5
Highlight Treatment Group function for the in vivo study of 8:2 Fluorotelomer Acrylate (8:2 FTAc) in rainbow trout. Colored boxes around metabolites in the metabolic map are correlated to the respective treatment groups, which are bile, blood, feces, kidney, and liver, in this case.
Figure 6
Figure 6
Metabolic map for heptadecafluorooctyl(tridecafluorohexyl)phosphinic acid (C6/C8 PFPiA) as found in rainbow trout [16] and rat [17].
Figure 7
Figure 7
Metabolic map for bis(perfluorooctyl)phosphinic acid (C8/C8 PFPiA) as found in rainbow trout [16], rat [17], carp [18], and wheat [19]. Structures as shown within the dotted box were assumed by the authors but were not actually observed metabolites in the studies.
Figure 8
Figure 8
Metabolic map for 2-[(6-chloro-1,1,2,2,3,3,4,4,5,5,6,6-dodecafluorohexyl)oxy]-1,1,2,2-tetrafluoroethanesulfonic acid (6:2 Cl-PFESA) as found in rainbow trout [20], rat [21], aerobic soil [22], and anaerobic sludge [23].
Figure 9
Figure 9
Metabolic map for N-Ethylperfluorooctane-1-sulfonamide (Sulfuramid; N-EtFOSA) as found in rainbow trout [24], rat [25,26,27,28], dog [27], sheep [29], beluga whale [26], polar bear [26], ringed seal [26], aerobic soil/sludge [31,32], pumpkin [34], soybean [34], wheat [34], zebrafish embryo [30], and rhizospheres [33]. Structures as shown within the dotted box were assumed by the authors but were not actually observed metabolites in the studies.
Figure 10
Figure 10
Metabolic map for SAmPAP diester as found in medaka [35], perch [36], aerobic sediment [37], and marine bacteria [38].
Figure 11
Figure 11
Metabolic map for Perfluorooctanesulfonamide (FOSA) as found in rainbow trout [39], rat [25,40], dog [40], human [40], monkey [40], aerobic sludge [32], earthworm [41,42], pumpkin [43], soybean [43], wheat [41], and zebrafish embryo [30].
Figure 12
Figure 12
Metabolic map for 8:2 Fluorotelomer phosphate diester (8:2 diPAP) as found in carp [44,45], rat [46], worm [44], loach [44], gilthead bream [47], mussel [48], aerobic soil [49,50], carrot [50], and lettuce [50]. Structures as shown within the dotted box were assumed by the authors but were not actually observed metabolites in the studies.
Figure 13
Figure 13
Metabolic map for 8:2 fluorotelomer alcohol (8:2 FTOH) as found in rainbow trout [39,51], rat [52,53,54,55,56], chicken [57], pig [58], human [59], zebrafish embryo [30], soybean [60], and aerobic soil [61,62]. Structures as shown within the dotted box were assumed by the authors but were not actually observed metabolites in the studies.
Figure 14
Figure 14
Metabolic map for 10:2 fluorotelomer alcohol (10:2 FTOH) as found in rainbow trout [39], earthworm [63], wheat [63], and soil [63].
Figure 15
Figure 15
Metabolic map for 6:2 fluorotelomer sulfonamide alkylbetaine (6:2 FTAB) as found in zebrafish [64], turbot [65], mussel [65], bacteria [66] and wastewater treatment sludge [67].
Figure 16
Figure 16
Metabolic map comparison of 8:2 FTOH in (left) rainbow trout hepatocytes and (right) in vivo chicken. Metabolites common to both species are indicated by green boxes. Differences in metabolites are indicated by red boxes. Tan boxes indicate phase II conjugates. Sensitivity, in this case 71.429%, is an assessment of the map comparison whereby the number of common metabolites is divided by the total number of metabolites in the fish map. Metabolites labeled with CIT are presumed intermediates in the path but were not identified in the study.
Figure 17
Figure 17
Metabolic map comparison of 8:2 FTOH in (left) rainbow trout hepatocytes and (right) in vivo rat. Metabolites common to both species are indicated by green boxes. Differences in metabolites are indicated by red boxes. Tan boxes indicate phase II conjugates. Sensitivity, in this case 69.231%, is an assessment of the map comparison whereby the number of common metabolites is divided by the total number of metabolites in the fish map. Metabolites labeled with CIT are presumed intermediates in the path but were not identified in the study.
Figure 18
Figure 18
Metabolic map comparison of 8:2 FTOH in (left) rainbow trout hepatocytes and (right) in vivo pig. Metabolites common to both species are indicated by green boxes. Differences in metabolites are indicated by red boxes. Tan boxes indicate phase II conjugates. Sensitivity, in this case 69.231%, is an assessment of the map comparison whereby the number of common metabolites is divided by the total number of metabolites in the fish map. Metabolites labeled with CIT are presumed intermediates in the path but were not identified in the study.
Figure 19
Figure 19
Metabolic map comparison of (left) 8:2 FTOH in rainbow trout hepatocytes and (right) 8:2 diPAP in vivo carp. Metabolites common to both species are indicated by green boxes. Differences in metabolites are indicated by red boxes. Tan boxes indicate phase II conjugates. Sensitivity, in this case 76.471%, is an assessment of the map comparison whereby the number of common metabolites is divided by the total number of metabolites in the fish map. Metabolites labeled with CIT are presumed intermediates in the path but were not identified in the study.

References

    1. Smart B.E. Characteristics of C-F systems. In: Banks R.E., Smart B.E., Tatlow J.C., editors. Organofluorine Chemistry: Principles and Commercial Applications. Plenum; New York, NY, USA: 1994. pp. 57–88.
    1. Kissa E. Fluorinated Surfactants: Synthesis–Properties–Applications (Surfactant Science Series 50) Marcel Dekker; New York, NY, USA: 1994. 469p
    1. Kissa E. Fluorinated Surfactants and Repellents (2nd Edition Revised and Expanded) (Surfactant Science Series 97) Marcel Dekker; New York, NY, USA: 2001. 640p
    1. Rao N.S., Baker B.E. Textile finishes and fluorosurfactants. In: Banks R.E., Smart B.E., Tatlow J.C., editors. Organofluorine Chemistry: Principles and Commercial Applications. Plenum; New York, NY, USA: 1994. pp. 321–338.
    1. 3M Company Fluorochemical Use, Distribution and Release Overview. USEPAAdministrative Record AR226-0550. [(accessed on 6 January 2023)];1999 Available online: https://www.regulations.gov/document/EPA-HQ-OPPT-2002-0051-0003.

LinkOut - more resources