. 2023 Jan 24;120(4):e2216531120.
doi: 10.1073/pnas.2216531120. Epub 2023 Jan 20.

Cell survival following direct executioner-caspase activation

Affiliations

Cell survival following direct executioner-caspase activation

Maddalena Nano et al. Proc Natl Acad Sci U S A. .

Erratum in

Abstract

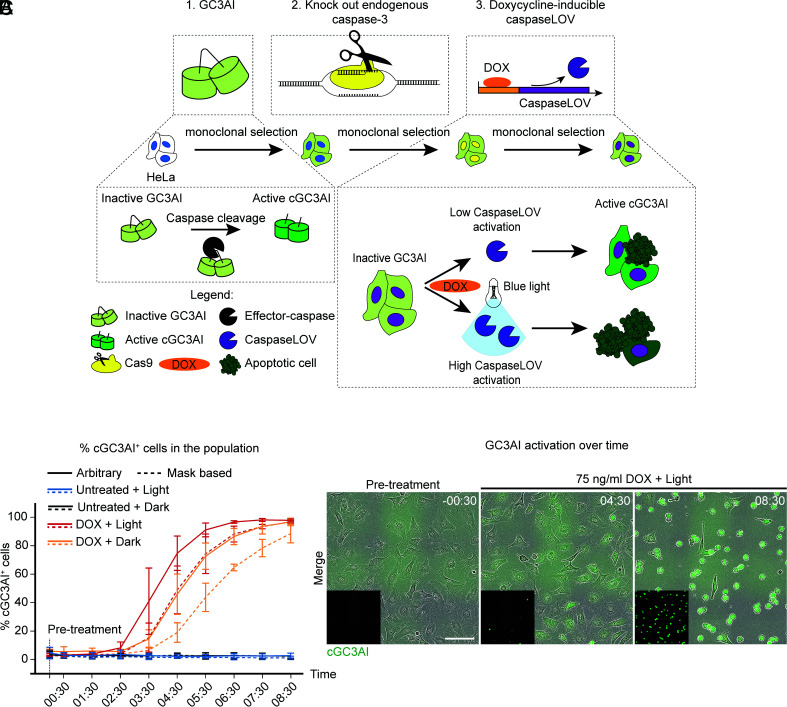
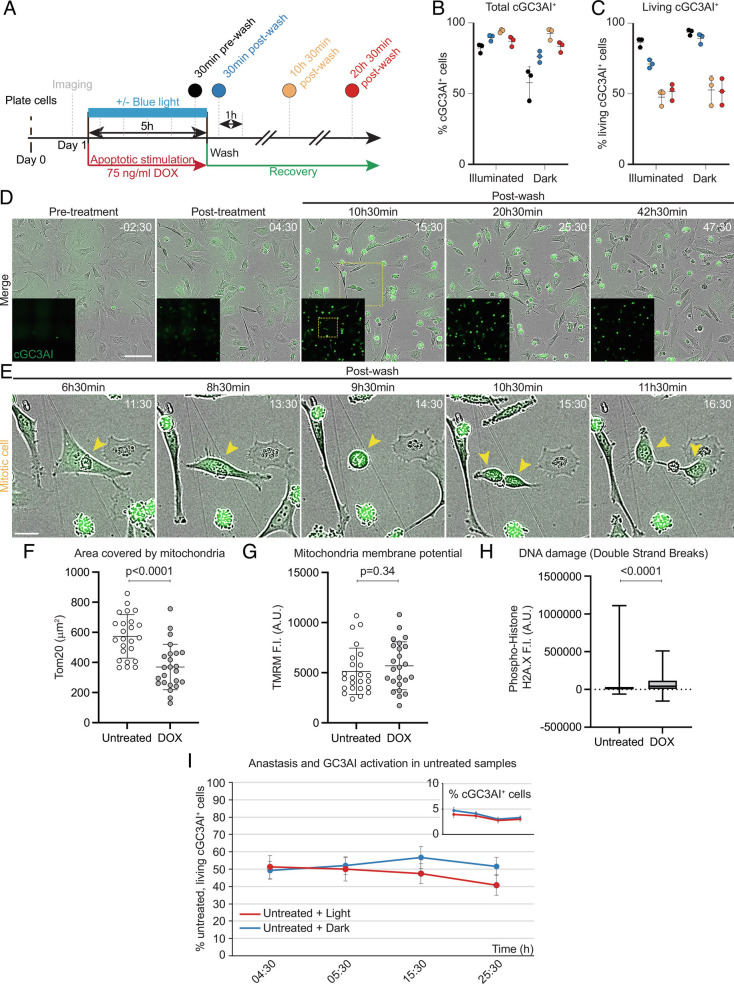
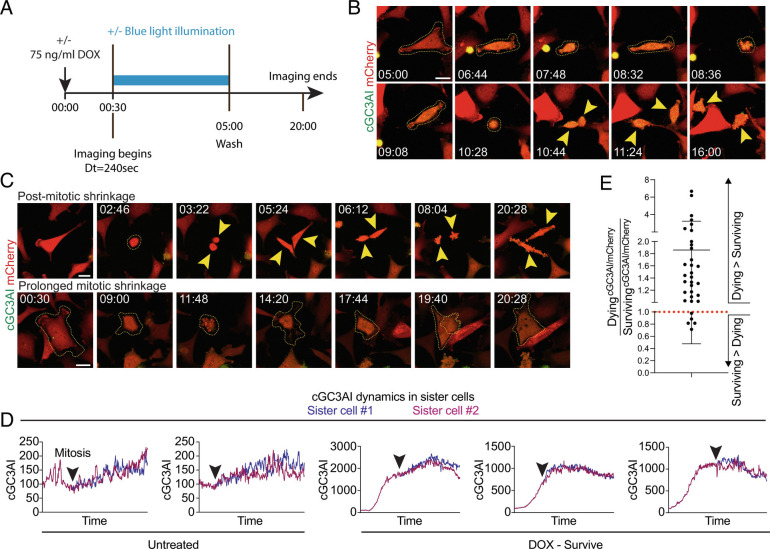
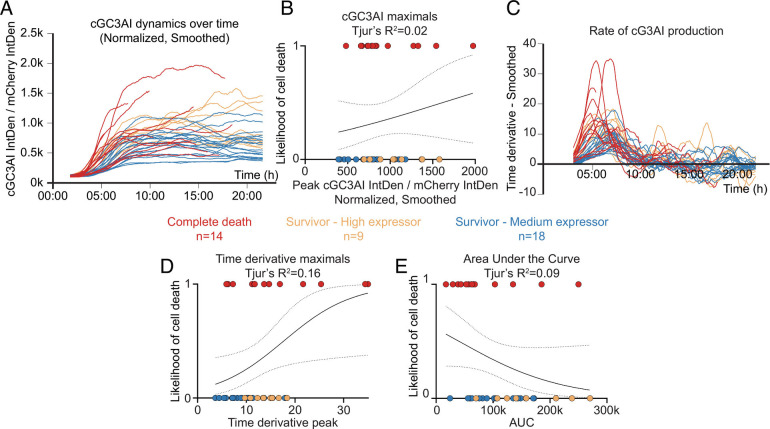
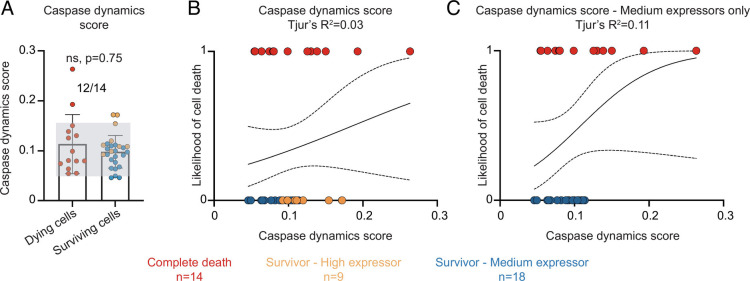
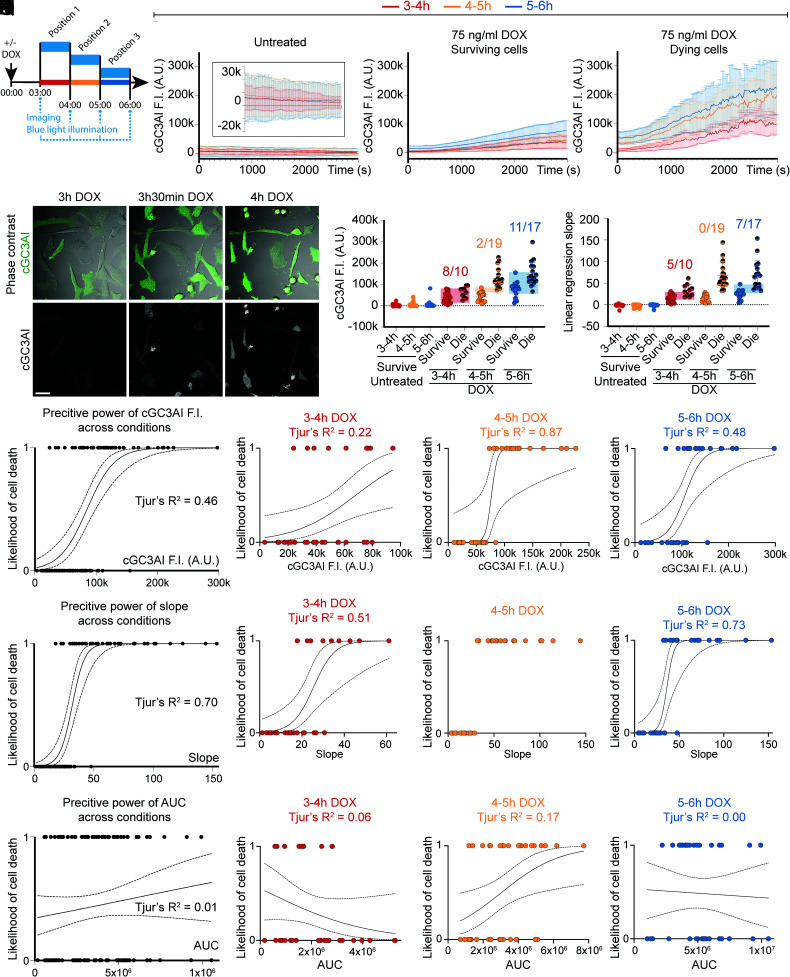
Executioner-caspase activation has been considered a point-of-no-return in apoptosis. However, numerous studies report survival from caspase activation after treatment with drugs or radiation. An open question is whether cells can recover from direct caspase activation without pro-survival stress responses induced by drugs. To address this question, we engineered a HeLa cell line to express caspase-3 inducibly and combined it with a quantitative caspase activity reporter. While high caspase activity levels killed all cells and very low levels allowed all cells to live, doses of caspase activity sufficient to kill 15 to 30% of cells nevertheless allowed 70 to 85% to survive. At these doses, neither the rate, nor the peak level, nor the total amount of caspase activity could accurately predict cell death versus survival. Thus, cells can survive direct executioner-caspase activation, and variations in cellular state modify the outcome of potentially lethal caspase activity. Such heterogeneities may underlie incomplete tumor cell killing in response to apoptosis-inducing cancer treatments.

Keywords: anastasis; apoptosis; effector caspase; predictive power; recovery.


Conflict of interest statement

The authors have organizational affiliations, stock ownership, and research support to disclose. D.J.M. is a member of the Board of Scientific Counselors for the National Cancer Institute; has 5% equity in Mór Bio, a subsidiary of Inceptor Bio, which is a cellular immunotherapy company; and has 20% equity in Anastasis Biotechnology Corporation. The authors have patent filings to disclose: Modulation of Anastasis, UCSB Case Number 2020-062-2, US Patent found in United States Provisional Patent Application Number 63/029,380, entitled “Methods of Modulating Anastasis,” filed May 22, 2020; Detection of Anastasis, UCSB Case Number 2020-62-1, found in US Patent United States Provisional Patent Application Number 63/029,358, entitled “Methods of Detecting Anastasis,” filed May 22, 2020; US provisional application no. 63/014,049 entitled “Stimulating US Patent Phagocytosis of Cancer Cells by Activating Rac in Macrophages” filed on April 23, 2020, with docket number P2495-USP; and US provisional application no. 63/126,379 entitled “Genetically US Patent Engineered Phagocytes and Related Compositions Methods and Systems” filed on December 16, 2020, with docket number P2495-USP2. D.J.M. has received research funds in the form of unrestricted gifts from the Anastasis Biotechnology Corporation and from Inceptor Bio.

Figures

Fig. 1.
Fig. 1.
Precise control of apoptotic stimulation with photoactivatable CaspaseLOV. (A) Schematic representation of how we generated caspaseLOV cells. The caspase sensor GC3AI was stably introduced in HeLa cells by lentiviral transduction. Endogenous caspase-3 was knocked out by CRISPR-Cas9. Cells were further transduced with DOX-inducible caspaseLOV. Cells underwent monoclonal selection and validation after each manipulation. GC3AI is cleaved and activated by effector caspases. DOX induces caspaseLOV expression and GC3AI activation. Blue light illumination enhances caspaseLOV activity. (B) Line chart indicating the percentage of GC3AI+ cells over time in caspaseLOV expressing cells in response to different treatments. GC3AI is inactive in the absence of DOX, it is maximal when 75 ng/mL DOX treatment is combined with illumination and it is delayed in the dark. Dotted lines: threshold-based identification of GC3AI positivity and manual counting. Solid lines: arbitrary (eye-based) estimation of GC3AI positivity and manual counting. Automated quantifications provided a rapid overview of cGC3AI increase over time. Manual counting confirmed the automated analysis and allowed quantification of both cGC3AI+ and cGC3AI cells. By 8 h 30 min post-treatment 98% of DOX-treated, illuminated cells and 97% of non-illuminated cells are cGC3AI+ (n = 412/420 illuminated cells, n = 497/515 non-illuminated cells, n = 3 independent experiments), compared to ≤4% of untreated controls (n = 11/464 cGC3AI+ illuminated cells, n = 9/459 cGC3AI+ non-illuminated cells; n = 3 independent experiments). Time post-treatment is in hh:mm. Error bars = SD. (C) Images from a timelapse series of HeLa cells stably encoding the effector caspase sensor GC3AI (green) and DOX-inducible caspaseLOV. Cells were treated with 75 ng/mL DOX and exposed to blue light. Over time, cells undergo sensor activation and shrinkage, indicative of cell death. Insets show cGC3AI. (Scale bar, 100 µm). Time is in hh:mm.
Fig. 2.
Fig. 2.
Cells can survive direct caspase activation. (A) Experimental design of recovery experiment. Apoptotic stimulation was carried out for 5 h with 75 ng/mL DOX, ±blue light illumination, and was then removed to allow cells to recover. After a pre-treatment acquisition, the sample was imaged hourly, starting 30 min post-treatment. (B, C) Dot plots indicating the percentage of total cGC3AI+ cells (B) and living cGC3AI+ cells (C) at different times after apoptotic stimulation (75 ng/mL DOX ± blue light illumination). (B) By the end of 5 h treatment (30 min pre-wash, black), 82% of illuminated cells activated GC3AI (n = 2,421/2,954 cells). The fraction of cGC3AI+ cells increased over time, reaching 94% 10 h 30 min post-wash (n = 3,104/3,296 cells, yellow). In the dark, 58% of cells activated GC3AI by 5 h (n = 837/1,437 cells, black) and 92% by 10 h 30 min post-treatment (n = 1,438/1,556 cells, yellow). (C) 51% of cGC3AI+ cells survive up to 20 h 30 min post-wash (n = 1,615/3,169 illuminated cGC3AI+ cells and 706/1,390 non-illuminated cGC3AI+ cells, red). Error bars = SD. Each dot represents one experiment (n = 3). (D) Images from a timelapse series of caspaseLOV-overexpressing cells during a recovery experiment. GC3AI is in green and in the Insets. (Scale bar, 100 µm). Time post-treatment is in hh:mm. Yellow square outlines the mitotic cell magnified in E. Related to SI Appendix, Fig. S2G. (E) cGC3AI+ cell undergoing mitosis. (Scale bar, 25 µm). (F) Quantifications of mitochondrial area (F), mitochondria activity (G), and DNA damage (H) in cGC3AI- untreated cells and cGC3AI+ anastatic cells. Fluorescence intensity (F.I.) is shown in Arbitrary Units (A.U.). Statistical significance: unpaired t test (F) and Mann–Whitney test (GH). Error bars = SD. (I) Line chart indicating the frequency of spontaneous anastasis in untreated cells exposed to light (red) or kept in the dark (blue). The frequency is robust and similar to what observed for DOX-treated cells 10 to 20 h after treatment (Fig. 2C). Inset shows the percentage of untreated cells experiencing spontaneous caspase activation, for the same time points shown in the main graph. Error bars = SD. More than 2,000 total cells and more than 75 cGC3AI+ cells were quantified for every time point. n = 3 independent experiments.
Fig. 3.
Fig. 3.
Surviving sister cells can have higher caspase levels than their dying siblings. (A) Experimental design of long-term live imaging experiment. After 30 min of apoptotic stimulation (75 ng/mL DOX), cells were imaged ±blue laser illumination every ~240 s (see Methods). Controls were not stimulated with DOX but were illuminated to control for phototoxicity. (B) Stills of a caspaseLOV cell undergoing mitosis after DOX treatment. GC3AI is in green. Stable mCherry expression (red) was used to normalize cGC3AI fluorescence. Yellow dotted lines outline the parental cell boundaries. Yellow arrowheads indicate daughter cells. The cell undergoes several brief shrinkage events. Time post-treatment is in hh:mm. Time 05:00 is the first acquisition post-washout. (Scale bar, 25 µm). (C) Representative examples of shrinkage. Time post-treatment is in hh:mm. (Scale bar, 25 µm). Top panels show daughter cells that undergo shrinkage after cell division. Yellow dotted lines outline the parental cell. Yellow arrowheads indicate daughter cells. Bottom panels show a parental cell undergoing a first round of abortive mitosis (notice the darker mCherry signal in the center of the cell, where the metaphase plate is). The cell blebs and attempts mitosis again, this time generating two superimposed cells that fuse in a single daughter. Yellow dotted lines outline cell boundaries. (D) Line graphs of representative cGC3AI dynamics in surviving sister cells (expressed as cGC3AI IntDen/mCherry IntDen and normalized). Note that y axes are not equivalent. Time is from beginning to end of imaging (~20 h). Black arrowheads indicate mitosis. (E) Dot plot chart showing the cGC3AI/mCherry ratio in dying versus surviving sister cells. A ratio greater than 1 (red dotted line) represents higher caspase activity in the dying sister, a ratio of 1 represents equal activity between sisters, and a ratio lower than 1 represents higher caspase activity in the surviving sister. In 5/33 couples of siblings analyzed, the surviving sister exhibited higher levels of caspase than its dying sibling.
Fig. 4.
Fig. 4.
Cell survival and cell death choices can occur independently of caspase dynamics. (A-E) Relationship between caspase activity and commitment to cell death. Data points are color-coded by fate or according to the level of total GC3AI (tGC3AI) measured by immunostaining (red = dying cells; orange = surviving cells with high tGC3AI; blue = surviving cells with average levels of tGC3AI). n = number of cells analyzed for each condition (from three independent experiments). (A) Line graph showing the dynamics of caspase activation over time in dying vs. surviving cells. Dynamics were obtained as percentage fold change of the ratio cGC3AI/mCherry over time after normalization. Before representation, data were smoothed using a moving average of 20. Smoothed data were used for further analysis. Curves pre-smoothing are shown in SI Appendix, Fig. S3 B and C. (B) Logistic regression between the maximum fold change recorded for cGC3AI (denoted “maximal” or “peak”) and the likelihood of cell death (0 = alive, 1 = dead) related to SI Appendix, Figs. S3D and S6A. (C) Line graph showing the smoothed time derivative of curves in A. Derivatives pre-smoothing are shown in SI Appendix, Fig. S3E. (D) Logistic regression between the maximum of the time derivative (denoted maximal or peak) and the likelihood of cell death (0 = alive, 1 = dead) related to SI Appendix, Figs. S3F and S6B. (E) Logistic regression between the area under the curve (AUC) of curves in A and the likelihood of cell death (0 = alive, 1 = dead) related to SI Appendix, Fig. S6C. Dotted lines represent the 95% confidence interval (C.I.). Tjur’s R2 evaluates the goodness of fit.
Fig. 5.
Fig. 5.
The cell state can determine whether a cell lives or dies. (A-C) Caspase dynamic score in dying (red) and surviving cells (orange = surviving cells with high tGC3AI; blue = surviving cells with average levels of tGC3AI). n = number of cells analyzed for each condition (from three independent experiments). (A) Dot plot chart and histogram showing the death score of dying and surviving cells. Error bars = SD. Lack of statistical significance (= 0.75) was assessed with Mann–Whitney test. Gray shading helps visualize dying and surviving cells with overlapping death scores. The numbers on top indicate the fraction of dying cells with death scores overlapping with surviving cells. (B and C) Logistic regression between the death score and the likelihood of cell death (0 = alive, 1 = dead) considering all surviving cells (B) or medium expressors only (C). Dotted lines represent the 95% C.I.. Tjur’s R2 evaluates the goodness of fit.
Fig. 6.
Fig. 6.
Stress increases the predictive power of the rate of caspase activation. (A) Experimental design. After 3 h of apoptotic stimulation (75 ng/mL DOX), the sample was imaged and stimulated with blue light at ~20 s interval. Three positions were imaged over three consecutive hours: position 1 (3 to 4 h DOX, red, n = 33 cells), position 2 (4 to 5 h DOX, orange, n = 37 cells), and position 3 (5 to 6 h DOX, blue, n = 35 cells). Controls were imaged in the same way but were not stimulated with DOX. Data are from three independent experiments. (BD) Line graphs of GC3AI F.I. in A.U. in untreated (B) and DOX-treated surviving (C) and dying (D) cells. Data plotted are the average of all cells analyzed and are relative to the first (red), second (orange), or third (blue) hour of imaging. The Inset in B shows the same data on an expanded y axis. Error bars = SD. (E) Stills of DOX-treated HeLa cells expressing caspaseLOV and GC3AI (green in the merged panel and gray). (Scale bar, 33 µm). (FG) Dot plots indicating cGC3AI F.I. (F) and slope of the linear regression of GC3AI F.I. (G). Data are relative to the first (red), second (orange), or third (blue) hour of imaging. Semi-transparent rectangles help visualizing dying and surviving cells with overlapping values. The numbers on top indicate the fraction of dying cells with values overlapping with surviving cells. (F) Dot plot showing the last value of GC3AI F.I. measured in untreated and DOX-treated surviving and dying cells. Surviving cells were measured at the last time point imaged, and dying cells were measured at cell death. (G) Dot plot showing the slope of linear regressions calculated on GC3AI F.I. (until the end of imaging for surviving cells, until death for dying cells). (HS) Logistic regressions between parameters of caspase activity and cell survival. Tjur’s R2 evaluates the goodness of fit. Dotted lines represent 95% C.I.. (HK) Logistic regression between the last value of GC3AI F.I. and the likelihood of cell death (0 = alive, 1 = dead) for DOX-treated cells in all conditions tested (H) and 3 to 4 h (I), 4 to 5 h (J), or 5 to 6 h (K) post-treatment. (LO) Logistic regression between the slope of linear regressions of GC3AI F.I. over time and the likelihood of cell death (0 = alive, 1 = dead) in all conditions tested (L) and 3 to 4 h (M, red), 4 to 5 h (N, orange), or 5 to 6 h (O, blue) post-treatment. (PS) Logistic regression between the AUC of GC3AI F.I. and the likelihood of cell death (0 = alive, 1 = dead) in all conditions tested (P) and 3 to 4 h (Q, red), 4 to 5 h (R, orange), or 5 to 6 h (S, blue) post-treatment.

Similar articles

Cited by

References

    1. Green D. R., The coming decade of cell death research: Five riddles. Cell 177, 1094–1107 (2019). - PMC - PubMed
    1. Cavallucci V., D’Amelio M., "Physiological and pathological role of apoptosis" in Apoptosome: An up-and-Coming Therapeutical Tool, Cecconi F., D’Amelio M., Eds. (Springer, Netherlands, 2010), pp. 1–26.
    1. Mohammad R. M., et al. , Broad targeting of resistance to apoptosis in cancer. Semin. Cancer Biol. 35 Suppl, S78–S103 (2015). - PMC - PubMed
    1. Neophytou C. M., Trougakos I. P., Erin N., Papageorgis P., Apoptosis deregulation and the development of cancer multi-drug resistance. Cancers 13, 4363 (2021). - PMC - PubMed
    1. Zhang P., Su D.-M., Liang M., Fu J., Chemopreventive agents induce programmed death-1-ligand 1 (PD-L1) surface expression in breast cancer cells and promote PD-L1-mediated T cell apoptosis. Mol. Immunol. 45, 1470–1476 (2008). - PubMed