. 2023 Jan 24;120(4):e2216055120.
doi: 10.1073/pnas.2216055120. Epub 2023 Jan 20.

Mammalian life depends on two distinct pathways of DNA damage tolerance

Affiliations

Mammalian life depends on two distinct pathways of DNA damage tolerance

Olimpia Alessandra Buoninfante et al. Proc Natl Acad Sci U S A. .

Abstract

DNA damage threatens genomic integrity and instigates stem cell failure. To bypass genotoxic lesions during replication, cells employ DNA damage tolerance (DDT), which is regulated via PCNA ubiquitination and REV1. DDT is conserved in all domains of life, yet its relevance in mammals remains unclear. Here, we show that inactivation of both PCNA-ubiquitination and REV1 results in embryonic and adult lethality, and the accumulation of DNA damage in hematopoietic stem and progenitor cells (HSPCs) that ultimately resulted in their depletion. Our results reveal the crucial relevance of DDT in the maintenance of stem cell compartments and mammalian life in unperturbed conditions.

Keywords: DNA damage response (DDR); DNA damage tolerance (DDT); embryonic lethality; erythropoiesis; hematopoietic stem cells.


Conflict of interest statement

The authors declare no competing interest.

Figures
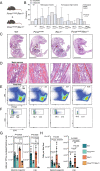
Fig. 1.
Fig. 1.
Absence of DDT results in embryonic lethality and severe hematopoietic stem cell failure. A, Breeding scheme to obtain DM embryos and mice. B, Observed and expected frequencies of offspring, obtained from PcnaK164R/+Rev1+/− intercrosses (Fisher’s exact test, 95% CI, n = 166, from 26 breeding pairs). C, Representative sagittal sections of WT, SMs, and PcnaKR Rev1−/− genotypes at E18.5. (Scale bar, 5 mm.) D, Microphotographs of H&E sections of BM from WT and PcnaK164R Rev1−/− E18.5. The PcnaK164R Rev1−/− BM showed the absence of hematopoietic cells which were replaced by stromal cells. Furthermore, the controls did show the presence of numerous dark-blue myeloid cells. (Scale bars, 50 µm.) E and F, Gating strategy and representative frequencies of LincKit+ cells, myeloid progenitors (LKS) and LSK of FL from WT and PcnaK164R Rev1−/− E18.5 embryos. G and H, Relative (G) and absolute (H) numbers of the defined hematopoietic subsets in E and F. In each graph, the bar represents the mean ± SD. WT n = 7, PcnaK164R n= 5, Rev1−/− n = 6, PcnaK164R Rev1−/− n= 5. Same in G and H but in H, the n for Rev1−/− is 9. The graphs indicate specific cells counts per 10−6 of live FL cells. P values were calculated using unpaired t test with Welch’s correction.
Fig. 2.
Fig. 2.
DDT deficiency results in DNA damage, apoptosis and cell cycle checkpoint activation in HSPCs. A, Analysis of transcriptomes by the SORT-Seq approach: FLs were isolated from E14.5 embryos, and LT-HSC, ST-HSC, and MPP2-4 cells from the LSK compartment were sorted into single wells, followed by scRNA-seq, allowing for downstream matching of the transcriptome with each cell type. For some analyses in this figure, transcriptomes from single cells were pooled into a semi-bulk, allowing for IPA analysis. B, Histogram representing the ratio between the number of DE genes associated with the cell cycle divided by total number of genes in cell cycle genes, enriched in each mutant compared to the WT as identified by IPA. The analysis for other graphs was the same, but here, the IPA identified DNA damage pathways, and senescence and cell death pathways were used. P values calculated using a right-tailed Fisher’s exact test with a Benjamini–Hochberg correction for multiple testing. C, Cell cycle state as analyzed by DAPI staining in LSK and myeloid progenitor cells from E18.5 FLs. P values calculated using unpaired t test with Welch’s correction. D, Percentage of γH2AX positive HSPCs in G1 and S/G2 of the cell cycle. The columns represent the mean ± SD. WT n = 6, PcnaK164R n= 7, Rev1−/− n = 5, PcnaK164R Rev1−/− n= 5. P values calculated using unpaired t test with Welch’s correction.
Fig. 3.
Fig. 3.
Erythroid cells present in LSKs and myeloid progenitors selectively remain in DM embryos. A, Percentages and numbers of indicated cell subsets sorted for SORT-Seq within the E14.5 LSK compartment. B, Single-cell transcriptome-based UMAP clustering of indicated genotypes. Color-coded cells correspond to indicated clusters. C, Quantification of the frequency of cells belonging to cluster 2 in each genotype, as determined by the SEURAT algorithm. D, Heatmap of handpicked genes related to differentiation of MEPs, CLPs, GMPs as well as depiction of marker genes of cluster 2 per genotype. E, GO analysis of differential genes of cluster 2 compared to the clusters, error bars denote GO scores of clusters from all embryos combined (total n = 11). F, Residence of MPP4s in each cluster, shown as the UMAP plots of SORT-Seq. Note the increased residence of MPP4s in cluster 2 in Rev1-/- and DM embryos. G, FACS representative example of CD24high CD93low population in Rev1−/− and DM FL LSKs. H, Frequency of CD24high CD93low population by flow cytometry in FL LSKs. I, FACS gating of LSKs, containing CD24ahighCD93low subset in WT and Klf1NAN E18.5 embryos. J, In each graph, the bar represents the mean ± SD. WT n = 15, Klf1NAN = 10. Quantification of CD24 MFI of LSK cells (Left) and frequency of CD24ahighCD93low population in WT and NAN E18.5 (Middle). The graphs on the right indicate specific cells counts per 1 × 10−6 of live cells. P values were calculated using unpaired t test with Welch correction. K, Composition of the myeloid compartment in WT and DM embryos. L and M, Relative (L) and absolute (M) numbers of indicated myeloid compartment cells. In each graph, the bar represents the mean ± SD. n for L: WT n = 7, PcnaK164R n= 5, Rev1−/− n = 6, PcnaK164R Rev1−/− n= 5. n for M: WT n = 7, PcnaK164R n= 5, Rev1−/− n = 9, PcnaK164R Rev1−/− n= 4. P values were calculated using unpaired t test with Welch’s correction.
Fig. 4.
Fig. 4.
DM embryos feature stressed erythropoeiesis and suffer from severe anemia. A, Gating strategy of EryA-C erythroid cells from E18.5 PcnaK164R Rev1−/− and control FLs. B and C, Blood cell maturation percentages (B) and absolute numbers (C) in FLs of PcnaK164R Rev1−/− embryos. Central line represents the mean ± SD. WT n = 7, PcnaK164R n= 5, Rev1−/− n = 5, PcnaK164R Rev1−/− n= 3. P values were calculated using Mann–Whitney U test. D, Frequency of erythrocytes in the FL, RBC count, and hemoglobin levels of RBCs. Central line represents the mean ± SD. WT n = 5, PcnaK164R n= 7, Rev1−/− n = 5, PcnaK164R Rev1−/− n= 3. P values were calculated using Mann–Whitney U test. E, Wright–Giemsa’s blood films of DMs, SMs and controls. DMs show signs of severe anemia. (Scale bar, 10 µm.) F, Microphotographs examples of Wright–Giemsa’s blood films of DM E18.5 embryos. Examples of anemic phenotype consist of: anisocytosis (variation in cell size: a mixed population of microcytes and macrocytes), polychromasia (reticulocytes), target cell (arrow), nucleated RBC (arrows), cells with basophilic inclusion body, blister cell (arrow), and Howell-Jolly bodies. (Scale bars, 10 mm.)
Fig. 5.
Fig. 5.
Absence of PCNA ubiquitination and REV1 is lethal in adult mice. A, Relative number of indicated cells of indicated genotypes in the BM of adult mice SM mice. B, Inducible inactivation of DDT in adult mice: Conditional ablation of a floxed PCNA allele in mice that feature a non-floxed PCNA-K164 or K164R allele results in the generation of PCNA-ub-dependent DDT-deficient mice, and "WT" controls. In the absence of functional REV1, this tamoxifen-inducible deletion results in the generation of DM mice. WT controls feature a heterozygous deletion of Rev1. C, Activation of the CreERT2 in the mice by intraperitoneal injection of tamoxifen results in the genetic rearrangement of the confetti construct present in the mice. This allows for long-term tracing of deleted cells in mice by determining the frequencies of cells expressing GFP, RFP, YFP, or CFP. D, (Top) The graphs indicate specific cells counts per 1 × 10−6 of single cells, after twp tamoxifen injections (right part of the graph), or after oil injection (left part of the graph). Data were pooled from two independent experiments. (Bottom) The graphs indicate the percentage of confetti-positive cells (expressing one or more colors of the confetti construct), after two tamoxifen injections after 2 and 4 wk (middle and right part of the graph), or after oil injection (left part of the graph). Data were pooled from two independent experiments. P values were calculated using an unpaired t test. From left to right, n = 4, 6, 5, 6, 5, 6.
Fig. 6.
Fig. 6.
Prolonging hematopoiesis in the absence of DDT: MPP4s support erythropoiesis. Upper: Inactivation of DDT through the inactivation of TLS recruitment by PCNA-Ub and REV1 causes replication stress, accumulation of DNA damage, cell checkpoint activation, and apoptosis in the hematopoietic system. Ultimately, these mutations lead to the development of lethal anemia in both, mouse embryos and adult mice. Middle: The hematopoietic crises caused by the lack of DDT reveals the persistence of an erythroid-like cluster, while other clusters are reduced. The persistence of this cluster appears to depend on the plasticity of MMP4, that are normally lymphoid committed. Lower: Proposed model of stressed hematopoiesis in DDT-deficient mice. Hematopoietic crises seen in double-mutant mice causes MPP4, normally committed to the lymphoid lineage cells, to differentiate toward erythroid-like progenitors. This plasticity ensures a prolonged erythroid output when canonical erythroid precursors are depleted as a consequence of genomic instability.

Similar articles

Cited by

References

    1. Moldovan G. L., Pfander B., Jentsch S., PCNA, the maestro of the replication fork. Cell 129, 665–679 (2007). - PubMed
    1. Friedberg E. C., Suffering in silence: The tolerance of DNA damage. Nat. Rev. Mol. Cell Biol. 6, 943–953 (2005). - PubMed
    1. Sale J. E., Lehmann A. R., Woodgate R., Y-family DNA polymerases and their role in tolerance of cellular DNA damage. Nat. Rev. Mol. Cell Biol. 13, 141–152 (2012). - PMC - PubMed
    1. Vujanovic M., et al. , Replication fork slowing and reversal upon DNA damage require PCNA polyubiquitination and ZRANB3 DNA translocase activity. Mol. Cell 67, 882–890.e5 (2017). - PMC - PubMed
    1. Pilzecker B., Buoninfante O. A., Jacobs H., DNA damage tolerance in stem cells, ageing, mutagenesis, disease and cancer therapy. Nucleic Acids Res. 47, 7163–7181 (2019). - PMC - PubMed

Publication types

Substances

Associated data