. 2023 May 1;21(5):411-427.
doi: 10.1158/1541-7786.MCR-22-0635.

BAP1 Loss Is Associated with Higher ASS1 Expression in Epithelioid Mesothelioma: Implications for Therapeutic Stratification

Affiliations

BAP1 Loss Is Associated with Higher ASS1 Expression in Epithelioid Mesothelioma: Implications for Therapeutic Stratification

Sarah E Barnett et al. Mol Cancer Res. .

Abstract

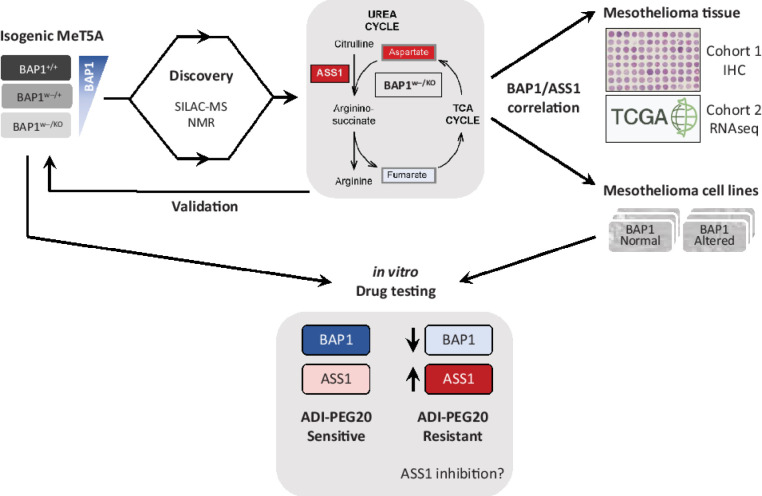
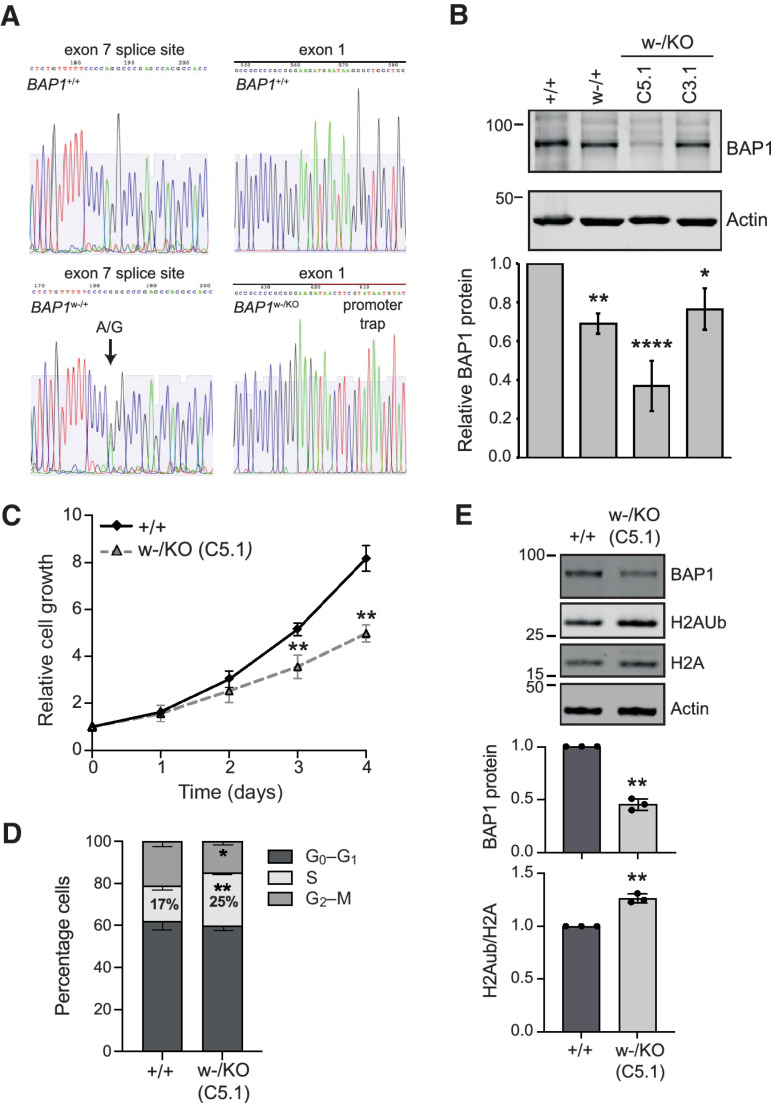
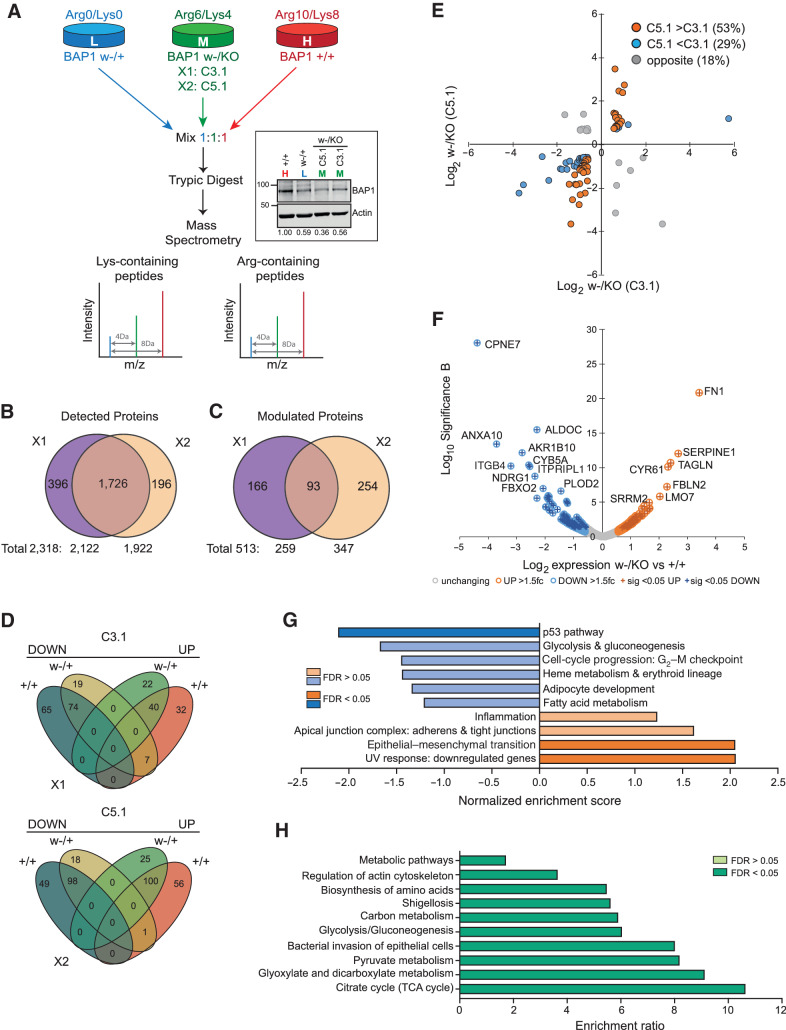
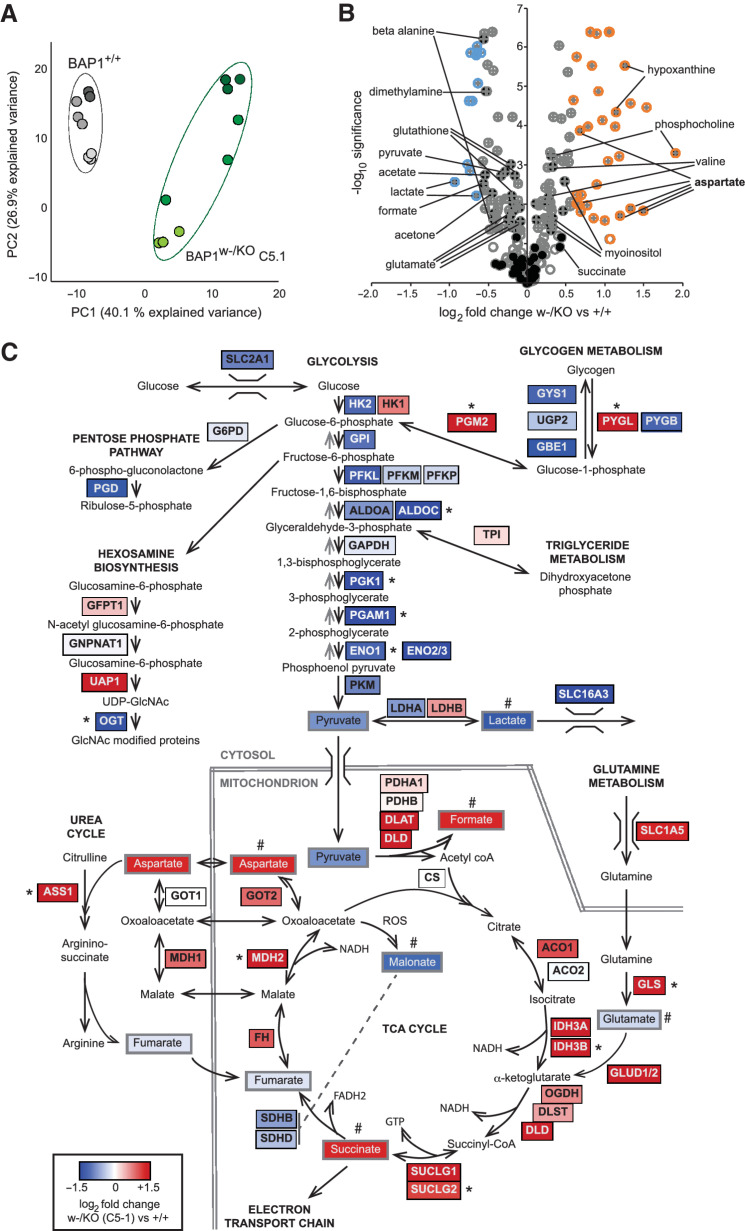
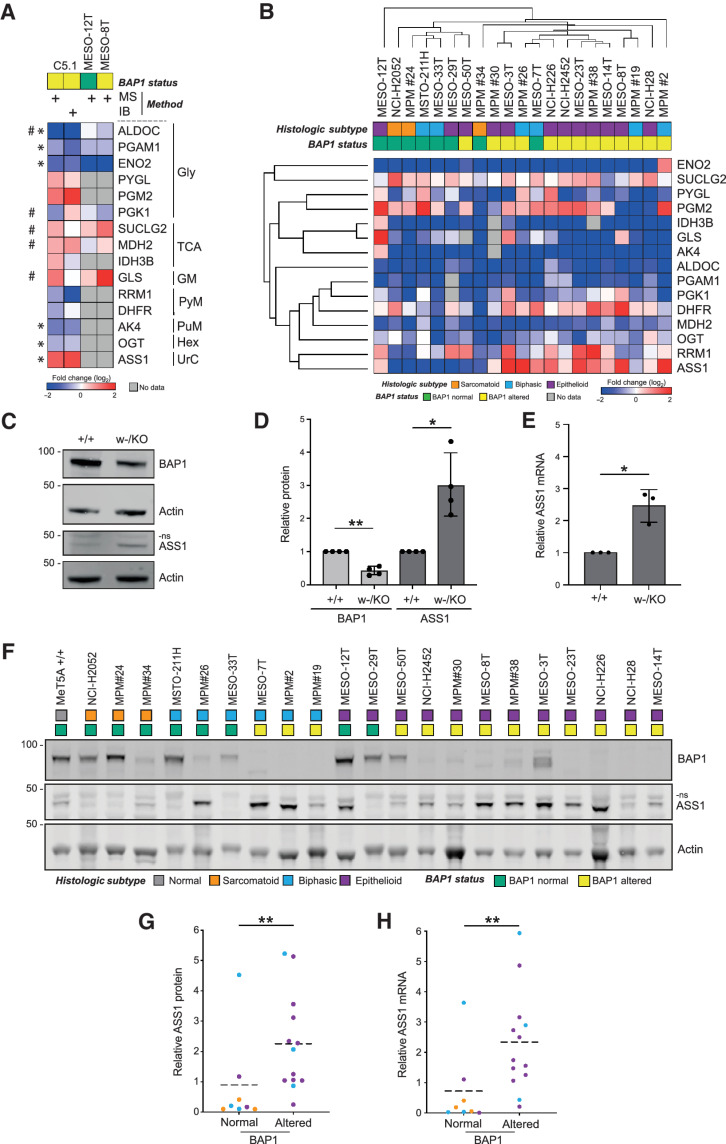
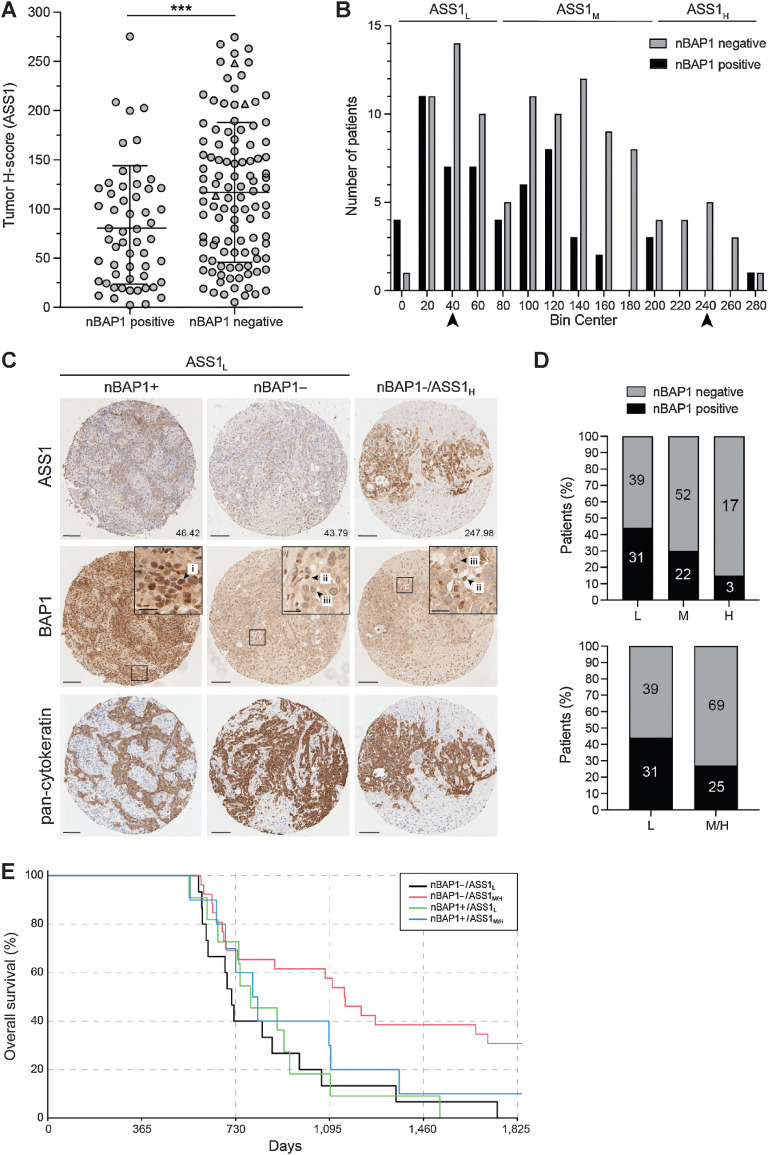
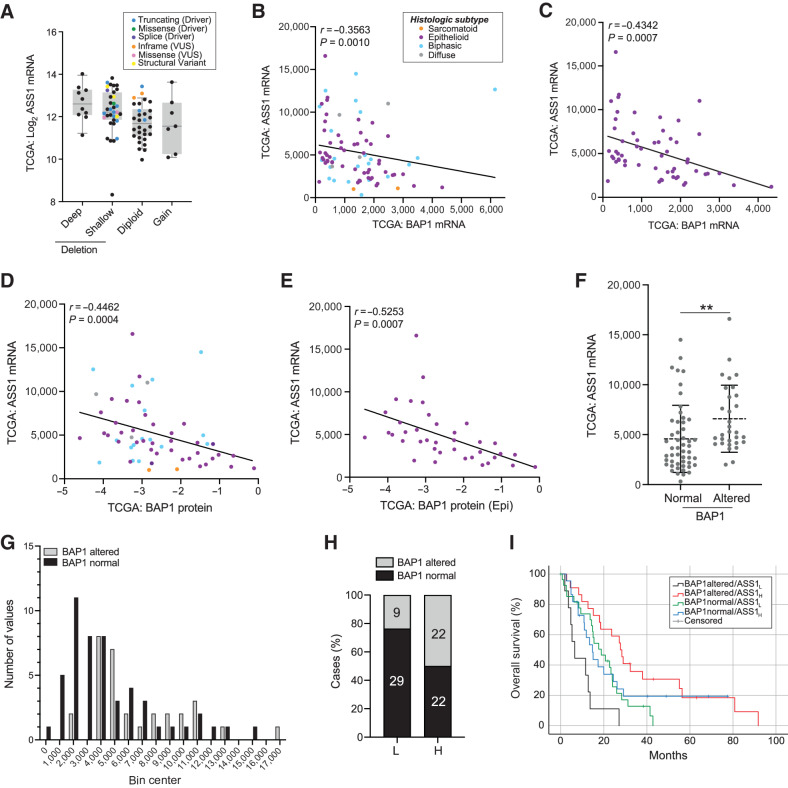
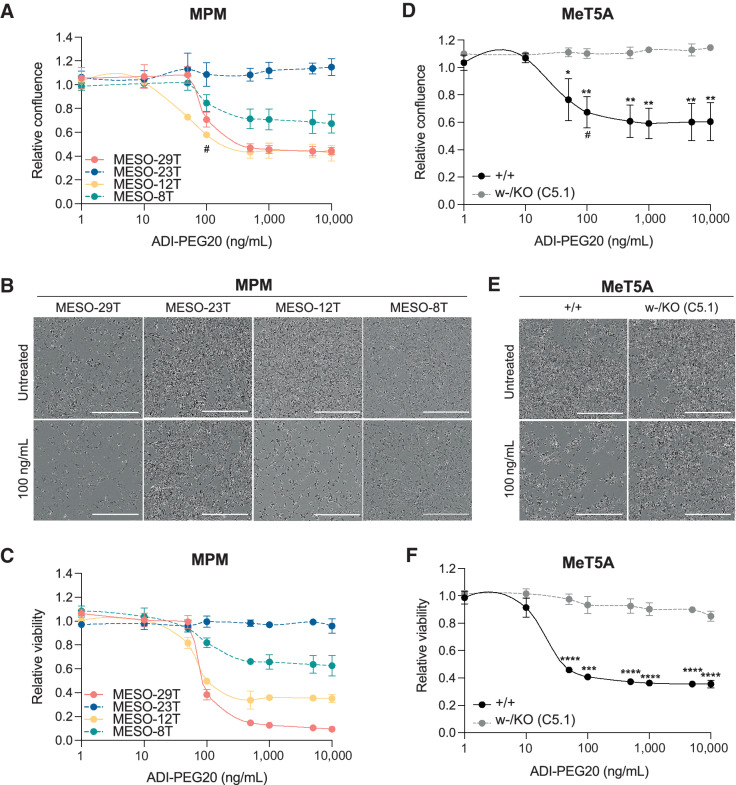
The nuclear deubiquitylase BRCA1-associated protein 1 (BAP1) is frequently inactivated in malignant pleural mesothelioma (MPM) and germline BAP1 mutation predisposes to cancers including MPM. To explore the influence on cell physiology and drug sensitivity, we sequentially edited a predisposition mutation (w-) and a promoter trap (KO) into human mesothelial cells. BAP1w-/KO MeT5A cells express less BAP1 protein and phenocopy key aspects of BAP1 loss in MPM. Stable isotope labeling with amino acids in cell culture-mass spectrometry revealed evidence of metabolic adaptation, with concomitant alteration of cellular metabolites. In MeT5A, BAP1 deficiency reduces glycolytic enzyme levels but increases enzymes involved in the tricarboxylic acid cycle and anaplerotic pathways. Notably both argininosuccinate synthase 1 (ASS1), essential for cellular synthesis of arginine, and its substrate aspartate, are elevated in BAP1w-/KO MeT5A cells. Likewise, ASS1 expression is higher in BAP1-altered MPM cell lines, and inversely correlates with BAP1 in The Cancer Genome Atlas MESO dataset. Elevated ASS1 is also evident by IHC staining in epithelioid MPM lacking nuclear BAP1 expression, with improved survival among patients with BAP1-negative/ASS1-expressing tumors. Alterations in arginine metabolism may sensitize cells to metabolic drugs and we find that BAP1-negative/ASS1-expressing MPM cell lines are more sensitive to ASS1 inhibition, although not to inhibition of purine synthesis by mizoribine. Importantly, BAP1w-/KO MeT5A become desensitized to arginine deprivation by pegylated arginine deiminase (ADI-PEG20), phenocopying BAP1-negative/ASS1-expressing MPM cell lines.

Implications: Our data reveal an interrelationship between BAP1 and arginine metabolism, providing a potential means of identifying patients with epithelioid MPM likely to benefit from ADI-PEG20.


Figures

None
Graphical abstract
Figure 1. BAP1w-/KO MeT5A cells recapitulate phenotypic aspects of BAP1-deficient MPM cells. A, Sequence confirmation of edited alleles: introduction of the w-family splice site mutation to induce exon 7 skipping (left) and a promoter trap to knockout (KO) BAP1 expression (right) in the isogenic MeT5A cells. B, BAP1 protein levels are constitutively reduced in BAP1w-/+ and BAP1w-/KO cells. Representative immunoblot and quantification relative to actin, mean of three independent experiments, error bars SD, one-way ANOVA with Dunnett post hoc test. *, P < 0.05; **, P < 0.01; ****, P < 0.0001. C, BAP1 deficiency slows proliferation of MeT5A cells. ATP-luciferase assay for BAP1w-/KO C5.1; mean of three independent experiments, error bars SD, t test. **, P < 0.01 compared with MeT5A-BAP1+/+. D, BAP1 deficiency causes MeT5A cells to accumulate in S-phase. Cell-cycle distribution determined by flow cytometry for BAP1w-/+ and BAP1w-/KO C5.1 (supporting data, Supplementary Fig. S5). Mean of three independent experiments, error bars SD; unpaired t test; *, P = 0.0303; **, P = 0.0014. E, H2A ubiquitylation is increased in BAP1-mutated MeT5A cells. Representative immunoblot and quantification, mean of three independent experiments, error bars SD, one-sample t test. **, P < 0.01.
Figure 1.
MeT5A BAP1w-/KO cells recapitulate phenotypic aspects of BAP1-deficient MPM cells. A, Sequence confirmation of edited alleles: introduction of the w-family splice site mutation to induce exon 7 skipping (left) and a promoter trap to knockout (KO) BAP1 expression (right) in the isogenic MeT5A cells. B, BAP1 protein levels are constitutively reduced in BAP1w-/+ and BAP1w-/KO cells. Representative immunoblot and quantification relative to actin, mean of three independent experiments, error bars SD, one-way ANOVA with Dunnett post hoc test. *, P < 0.05; **, P < 0.01; ****, P < 0.0001. C, BAP1 deficiency slows proliferation of MeT5A cells. ATP-luciferase assay for BAP1w-/KO C5.1; mean of three independent experiments, error bars SD, t test. **, P < 0.01 compared with MeT5A-BAP1+/+. D, BAP1 deficiency causes MeT5A cells to accumulate in S-phase. Cell-cycle distribution determined by flow cytometry for BAP1+/+ and BAP1w-/KO C5.1 (supporting data, Supplementary Fig. S5E). Mean of three independent experiments, error bars SD; unpaired t test; *, P = 0.0303; **, P = 0.0014. E, H2A ubiquitylation is increased in BAP1-mutated MeT5A cells. Representative immunoblot and quantification, mean of three independent experiments, error bars SD, one-sample t test. **, P < 0.01.
Figure 2. BAP1 deficiency reprograms the proteome of MeT5A cells. A, Experimental strategy for triplex SILAC-MS analysis of isogenic MeT5A cells, two alternative configurations (X1 and X2) used either the MeT5A-BAP1w-/KO C5.1 or C3.1 clones. Inset shows stable BAP1 expression after 6 passages in SILAC-labeling media; numbers indicate mean expression relative to BAP1+/+ cells from three independent analyses. B, Summary of proteins identified by MS across two experiments, based on gene name identifiers; supporting data, Supplementary Table S3. C, Summary of proteins modulated >1.5-fold in BAP1w-/KO relative to either BAP1+/+ or BAP1w-/+ cells. D, Overview of directional expression changes in each experimental configuration for the 513 proteins modulated by >1.5-fold. E, Relative expression of the 93 proteins modulated >1.5-fold in both BAP1w-/KO clones. F, Volcano plot showing proteins modulated >1.5-fold (colored circles) with P < 0.05 (crossed circles) in C5.1 BAP1w-/KO cells. G and H, Heatmaps summarizing functional annotation of enriched pathways for proteins modulated by >1.5-fold in C5.1 BAP1w-/KO cells. Gene set enrichment analysis showing weighted set cover for Hallmark-50 pathways: blue, C5.1 downregulated proteins; orange, C5.1 upregulated proteins (G); supporting data in Supplementary Fig. S7A and S7B. Overrepresentation analysis for KEGG pathways among all C5.1 modulated proteins (H).
Figure 2.
BAP1 deficiency reprograms the proteome of MeT5A cells. A, Experimental strategy for triplex SILAC-MS analysis of isogenic MeT5A cells, two alternative configurations (X1 and X2) used either the MeT5A-BAP1w-/KO C5.1 or C3.1 clones. Inset shows stable BAP1 expression after 6 passages in SILAC-labeling media; numbers indicate mean expression relative to BAP1+/+ cells from three independent analyses. B, Summary of proteins identified by MS across two experiments, based on gene name identifiers; supporting data, Supplementary Table S3. C, Summary of proteins modulated >1.5-fold in BAP1w-/KO relative to either BAP1+/+ or BAP1w-/+ cells. D, Overview of directional expression changes in each experimental configuration for the 513 proteins modulated by >1.5-fold. E, Relative expression of the 93 proteins modulated >1.5-fold in both BAP1w-/KO clones. F, Volcano plot showing proteins modulated >1.5-fold (colored circles) with P < 0.05 (crossed circles) in C5.1 BAP1w-/KO cells. G and H, Heatmaps summarizing functional annotation of enriched pathways for proteins modulated by >1.5-fold in C5.1 BAP1w-/KO cells. Gene set enrichment analysis showing weighted set cover for Hallmark-50 pathways: blue, C5.1 downregulated proteins; orange, C5.1 upregulated proteins (G); supporting data in Supplementary Fig. S7A and S7B. Overrepresentation analysis for KEGG pathways among all C5.1 modulated proteins (H).
Figure 3. BAP1-deficient MeT5A cells have altered levels of metabolites and metabolic enzymes. A and B, NMR analysis reveals altered metabolites in C5.1 BAP1w-/KO relative to BAP1+/+ MeT5A. PCA plot for samples from three independent experiments analyzed in triplicate (A). Volcano plot of metabolites modulated >1.5-fold (colored circles) with P < 0.05 (crossed circles), named metabolites (filled black circles; B). C, Overview of metabolic adaptation for key pathways in BAP1-deficient MeT5A cells combining proteomic and metabolomic data, color scale represents log2 fold change in C5.1 MeT5A-BAP1w-/KO versus BAP1+/+ cells. *Enzymes investigated further. #Significantly modulated metabolites (supporting data, Supplementary Table S4; Supplementary Fig. S8).
Figure 3.
BAP1-deficient MeT5A cells have altered levels of metabolites and metabolic enzymes. A and B, NMR analysis reveals altered metabolites in C5.1 BAP1w-/KO relative to BAP1+/+ MeT5A. PCA plot for samples from three independent experiments analyzed in triplicate (A). Volcano plot of metabolites modulated >1.5-fold (colored circles) with P < 0.05 (crossed circles), named metabolites (filled black circles; B). C, Overview of metabolic adaptation for key pathways in BAP1-deficient MeT5A cells combining proteomic and metabolomic data, color scale represents log2 fold change in C5.1 MeT5A-BAP1w-/KO versus BAP1+/+ cells. *Enzymes investigated further. #Significantly modulated metabolites (supporting data, Supplementary Table S4; Supplementary Fig. S8).
Figure 4. ASS1 expression is a metabolic BAP1 dependency in isogenic MeT5A and MPM cell lines. A, Heatmap comparing expression in BAP1w-/KO C5.1 cells determined by SILAC-MS or immunoblotting (IB, three independent experiments, supporting data in Supplementary Fig. S9), with SILAC-MS data (n = 1; supporting data, Supplementary Table S3) for two epithelioid MPM cell lines: MESO-8T (BAP1-altered), MESO-12T (BAP1-normal). *Significant modulation confirmed in MeT5A by immunoblotting, #data for MESO-8T versus MESO-12T consistent with BAP1 dependency in MeT5A. Gly, glycolysis; TCA, tricarboxylic acid cycle; GM, glycogen metabolism; PyM, pyrimidine metabolism; PuM, purine metabolism; Hex, hexosamine biosynthesis; UrC, urea cycle. B, Unsupervised hierarchical clustering for expression in 21 MPM cell lines determined by immunoblotting. Heatmap shows protein levels for selected metabolic enzymes in cell lines relative to BAP1+/+ MeT5A. Key indicates histologic subtype and BAP1 status, supporting data in Supplementary Figs. S10 and S11. ASS1 protein levels increase in BAP1w-/KO MeT5A cells. Representative immunoblot with anti-ASS1 antibody (Millipore; C) and quantification (D). Mean of four independent experiments, error bars SD; Welch t test; *, P = 0.026; **, P = 0.003; ns, non-specific band. E, ASS1 mRNA expression increases in BAP1w-/KO MeT5A cells. ASS1 qRT-PCR normalized to ACTB and GAPDH; mean of three independent experiments, error bars SD; Welch t test; *, P = 0.021. F–H, ASS1 protein and mRNA expression are significantly higher in BAP1-altered than BAP1-normal MPM cell lines. Representative immunoblot for the cell panel (F); histologic subtype and BAP1 status indicated; ns, non-specific band. Mean ASS1 protein level from three independent experiments (G); normalized to actin and relative to MeT5A BAP1+/+, population mean (dashed line), Mann–Whitney **, P = 0.006. Mean ASS1 mRNA determined by qRT-PCR (H); normalized to ACTB and GAPDH relative to MeT5A BAP1+/+ from three independent experiments, population mean (dashed line), Mann–Whitney **, P = 0.006. For G and H, histologic subtype is indicated in F; supporting data, Supplementary Fig. S12.
Figure 4.
ASS1 expression is a metabolic BAP1 dependency in isogenic MeT5A and MPM cell lines. A, Heatmap comparing expression in BAP1w-/KO C5.1 cells determined by SILAC-MS or immunoblotting (IB, three independent experiments, supporting data in Supplementary Fig. S9), with SILAC-MS data (n = 1; supporting data, Supplementary Table S3) for two epithelioid MPM cell lines: MESO-8T (BAP1-altered), MESO-12T (BAP1-normal). *Significant modulation confirmed in MeT5A by immunoblotting, #data for MESO-8T versus MESO-12T consistent with BAP1 dependency in MeT5A. Gly, glycolysis; TCA, tricarboxylic acid cycle; GM, glycogen metabolism; PyM, pyrimidine metabolism; PuM, purine metabolism; Hex, hexosamine biosynthesis; UrC, urea cycle. B, Unsupervised hierarchical clustering for expression in 21 MPM cell lines determined by immunoblotting. Heatmap shows protein levels for selected metabolic enzymes in cell lines relative to MeT5A BAP1+/+. Key indicates histologic subtype and BAP1 status, supporting data in Supplementary Figs. S10 and S11. ASS1 protein levels increase in MeT5A BAP1w-/KO cells. Representative immunoblot with anti-ASS1 antibody (Millipore; C) and quantification (D). Mean of four independent experiments, error bars SD; Welch t test; *, P = 0.026; **, P = 0.003; ns, non-specific band. E,ASS1 mRNA expression increases in MeT5A BAP1w-/KO cells. ASS1 qRT-PCR normalized to ACTB and GAPDH; mean of three independent experiments, error bars SD; Welch t test; *, P = 0.021. FH, ASS1 protein and mRNA expression are significantly higher in BAP1-altered than BAP1-normal MPM cell lines. Representative immunoblot for the cell panel (F); histologic subtype and BAP1 status indicated; ns, non-specific band. Mean ASS1 protein level from three independent experiments (G); normalized to actin and relative to MeT5A BAP1+/+, population mean (dashed line), Mann–Whitney **, P = 0.006. Mean ASS1 mRNA determined by qRT-PCR (H); normalized to ACTB and GAPDH relative to MeT5A BAP1+/+ from three independent experiments, population mean (dashed line), Mann–Whitney **, P = 0.006. For G and H, histologic subtype is indicated in F; supporting data, Supplementary Fig. S12.
Figure 5. ASS1 protein levels are elevated in epithelioid MPM samples with loss of nBAP1. nBAP1 staining was scored as positive (n = 56) or negative (n = 108) by three independent observers, and mean ASS1 tumor H-scores digitally determined for 164 epithelioid samples (2 to 4 cores per patient). A, ASS1 expression is higher in epithelioid MPM without nBAP1; bars indicate mean and 1 SD; Mann–Whitney test, ***, P = 0.001. B, Frequency distribution of ASS1 tumor H-scores defines three groups: ASS1L (low ASS1, tumor H-score <80); ASS1M (moderate ASS1, tumor H-score ≥80–200); ASS1H (high ASS1, tumor H-score ≥200). C, Images of MPM cores representing the mid-point of the ASS1L and ASS1H groups (indicated by arrow heads in B). The tumor H-score for ASS1 is shown; magnified insets indicate (i) nBAP1-positive tumor cells, (ii) nBAP1-positive stromal cells, (iii) nBAP1-negative tumor cells. Scale bars, 100 or 20 μm in insets. D, Loss of nBAP1 is more frequent in groups with higher ASS1 expression. Comparison of the three ASS1 groups χ2 test, ***, P < 0.0001 (top); and ASS1 L group compared to the combined ASS1M/H groups, Fisher exact test, *, P = 0.018 (below). The numbers of nBAP1-positive or nBAP1-negative patients in each group are indicated. E, Improved survival of patients with nBAP1-negative ASS1M/H tumors. Kaplan–Meier curve is shown at 18-month landmark. Cox model: nBAP1-negative ASS1M/H (n = 26) versus ASS1L (n = 15) P = 0.003; nBAP1-positive ASS1M/H (n = 10) versus ASS1L (n = 11) P = 0.383; supporting data in Supplementary Table S5 and Supplementary Fig. S13.
Figure 5.
ASS1 protein levels are elevated in epithelioid MPM samples with loss of nBAP1. nBAP1 staining was scored as positive (n = 56) or negative (n = 108) by three independent observers, and mean ASS1 tumor H-scores digitally determined for 164 epithelioid samples (2 to 4 cores per patient). A, ASS1 expression is higher in epithelioid MPM without nBAP1; bars indicate mean and 1 SD; Mann–Whitney test, ***, P = 0.001. B, Frequency distribution of ASS1 tumor H-scores defines three groups: ASS1L (low ASS1, tumor H-score <80); ASS1M (moderate ASS1, tumor H-score ≥80–200); ASS1H (high ASS1, tumor H-score ≥200). C, Images of MPM cores representing the mid-point of the ASS1L and ASS1H groups (indicated by arrow heads in B). The tumor H-score for ASS1 is shown; magnified insets indicate (i) nBAP1-positive tumor cells, (ii) nBAP1-positive stromal cells, (iii) nBAP1-negative tumor cells. Scale bars, 100 or 20 μm in insets. D, Loss of nBAP1 is more frequent in groups with higher ASS1 expression. Comparison of the three ASS1 groups χ2 test, ***, P < 0.0001 (top); and ASS1 L group compared to the combined ASS1M/H groups, Fisher exact test, *, P = 0.018 (below). The numbers of nBAP1-positive or nBAP1-negative patients in each group are indicated. E, Improved survival of patients with nBAP1-negative ASS1M/H tumors. Kaplan–Meier curve is shown at 18-month landmark. Cox model: nBAP1-negative ASS1M/H (n = 26) versus ASS1L (n = 15) P = 0.003; nBAP1-positive ASS1M/H (n = 10) versus ASS1L (n = 11) P = 0.383; supporting data in Supplementary Table S5 and Supplementary Fig. S13.
Figure 6. Association between BAP1 status, ASS1 transcript expression and survival in TCGA MESO cohort. A, ASS1 transcript levels are higher in cases with deletion and/or mutation of BAP1. Putative BAP1 copy-number variations from GISTIC; ASS1 mRNA expression log2 batch normalized RSEM, colored by BAP1 mutation. B–E, Inverse correlation of ASS1 mRNA (batch normalized RSEM) with BAP1 colored by histologic type as indicated in B. BAP1 mRNA (for the cohort, n = 82 (B) or only the epithelioid cases, n = 58 (C), and BAP1 protein (RPPA) for the cohort, n = 59 (D) or only the epithelioid cases, n = 38 (E); Spearman correlations shown. F, ASS1 mRNA is higher in BAP1-altered cases (deletion and/or mutation); n = 82, bars indicate mean and 1 SD; Mann–Whitney test, **, P = 0.0016. G, Frequency distribution of ASS1 mRNA stratified by BAP1 status. H, BAP1 alteration is more frequent in tumors with higher ASS1 expression. ASS1 transcript stratified by z-scores: below zero (ASS1-low) or above zero (ASS1-high); Fisher exact test, ****, P = 0.0002; the numbers of BAP1-normal or BAP1-altered patients in each group are indicated. I, Improved survival of patients with BAP1-altered ASS1-high tumors. Kaplan–Meier analysis for 69 uncensored patients according to groups in H. Median survival (lower and upper bound): BAP1-altered ASS1-high 21.6–33.9 months (n = 19), BAP1-altered ASS1-low 2.7–10.2 months (n = 9), BAP1-normal ASS1-high 10.1–19.3 months (n = 17), BAP1-normal ASS1-low 11.8–25.8 months (n = 24); Log-rank (Mantel–Cox) P = 0.001. The results shown in this figure are based upon data generated by TCGA Research Network: https://www.cancer.gov/tcga.
Figure 6.
Association between BAP1 status, ASS1 transcript expression and survival in TCGA MESO cohort. A,ASS1 transcript levels are higher in cases with deletion and/or mutation of BAP1. Putative BAP1 copy-number variations from GISTIC; ASS1 mRNA expression log2 batch normalized RSEM, colored by BAP1 mutation. BE, Inverse correlation of ASS1 mRNA (batch normalized RSEM) with BAP1 colored by histologic type as indicated in B. BAP1 mRNA (for the cohort, n = 82 (B) or only the epithelioid cases, n = 58 (C), and BAP1 protein (RPPA) for the cohort, n = 59 (D) or only the epithelioid cases, n = 38 (E); Spearman correlations shown. F,ASS1 mRNA is higher in BAP1-altered cases (deletion and/or mutation); n = 82, bars indicate mean and 1 SD; Mann–Whitney test, **, P = 0.0016. G, Frequency distribution of ASS1 mRNA stratified by BAP1 status. H,BAP1 alteration is more frequent in tumors with higher ASS1 expression. ASS1 transcript stratified by z-scores: below zero (ASS1-low) or above zero (ASS1-high); Fisher exact test, ****, P = 0.0002; the numbers of BAP1-normal or BAP1-altered patients in each group are indicated. I, Improved survival of patients with BAP1-altered ASS1-high tumors. Kaplan–Meier analysis for 69 uncensored patients according to groups in H. Median survival (lower and upper bound): BAP1-altered ASS1-high 21.6–33.9 months (n = 19), BAP1-altered ASS1-low 2.7–10.2 months (n = 9), BAP1-normal ASS1-high 10.1–19.3 months (n = 17), BAP1-normal ASS1-low 11.8–25.8 months (n = 24); Log-rank (Mantel–Cox) P = 0.001. The results shown in this figure are based upon data generated by TCGA Research Network: https://www.cancer.gov/tcga.
Figure 7. The influence of BAP1 status on response to arginine deprivation with ADI-PEG20. Paired MPM cell lines MESO-29T (BAP1-normal/ASS1-low) and MESO-23T (BAP1-altered/ASS1-high), MESO-12T (BAP1-normal/ASS1-low) and MESO-8T (BAP1-altered/ASS1-high; A–C) or MeT5A BAP1+/+ and BAP1w-/KO cells (D–F) were treated for 96 hours with ADI-PEG20; mean of three independent experiments, error bars SD; t test; *, P < 0.05; **, P < 0.01; ***, P < 0.001; ****, P < 0.0001. Dose response for relative confluence assessed by live imaging at 96 hours (A and D), # indicates 100 ng/mL ADI-PEG20, the approximate LC50 for sensitive cells, for which representative images at 96 hours are shown (B and E). ATP-based luciferase assay conducted following imaging at 96 hours (C and F). Supporting data, Supplementary Fig. S16F.
Figure 7.
The influence of BAP1 status on response to arginine deprivation with ADI-PEG20. Paired MPM cell lines MESO-29T (BAP1-normal/ASS1-low) and MESO-23T (BAP1-altered/ASS1-high), MESO-12T (BAP1-normal/ASS1-low) and MESO-8T (BAP1-altered/ASS1-high; AC) or MeT5A BAP1+/+ and BAP1w-/KO cells (DF) were treated for 96 hours with ADI-PEG20; mean of three independent experiments, error bars SD; t test; *, P < 0.05; **, P < 0.01; ***, P < 0.001; ****, P < 0.0001. Dose response for relative confluence assessed by live imaging at 96 hours (A and D), # indicates 100 ng/mL ADI-PEG20, the approximate LC50 for sensitive cells, for which representative images at 96 hours are shown (B and E). ATP-based luciferase assay conducted following imaging at 96 hours (C and F). Summary data, Supplementary Fig. S16F.

Comment in

  • 1541-7786. doi: 10.1158/1541-7786.MCR-21-5-HI

References

    1. Takahashi K, Landrigan PJ, Collegium R. The global health dimensions of asbestos and asbestos-related diseases. Ann Glob Health 2016;82:209–13. - PubMed
    1. Chernova T, Murphy FA, Galavotti S, Sun XM, Powley IR, Grosso S, et al. . Long-fiber carbon nanotubes replicate asbestos-induced mesothelioma with disruption of the tumor suppressor gene Cdkn2a (Ink4a/Arf). Curr Biol 2017;27:3302–14. - PMC - PubMed
    1. Blum Y, Meiller C, Quetel L, Elarouci N, Ayadi M, Tashtanbaeva D, et al. . Dissecting heterogeneity in malignant pleural mesothelioma through histo-molecular gradients for clinical applications. Nat Commun 2019;10:1333. - PMC - PubMed
    1. Zalcman G, Mazieres J, Margery J, Greillier L, Audigier-Valette C, Moro-Sibilot D, et al. . Bevacizumab for newly diagnosed pleural mesothelioma in the mesothelioma avastin cisplatin pemetrexed study (MAPS): a randomised, controlled, open-label, phase 3 trial. Lancet 2016;387:1405–14. - PubMed
    1. Baas P, Scherpereel A, Nowak AK, Fujimoto N, Peters S, Tsao AS, et al. . First-line nivolumab plus ipilimumab in unresectable malignant pleural mesothelioma (CheckMate 743): a multicentre, randomised, open-label, phase 3 trial. Lancet 2021;397:375–86. - PubMed

Publication types