. 2023 Jan 19;186(2):382-397.e24.
doi: 10.1016/j.cell.2022.12.031.

Lymphatic vessels in bone support regeneration after injury

Affiliations

Lymphatic vessels in bone support regeneration after injury

Lincoln Biswas et al. Cell. .

Abstract

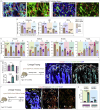
Blood and lymphatic vessels form a versatile transport network and provide inductive signals to regulate tissue-specific functions. Blood vessels in bone regulate osteogenesis and hematopoiesis, but current dogma suggests that bone lacks lymphatic vessels. Here, by combining high-resolution light-sheet imaging and cell-specific mouse genetics, we demonstrate presence of lymphatic vessels in mouse and human bones. We find that lymphatic vessels in bone expand during genotoxic stress. VEGF-C/VEGFR-3 signaling and genotoxic stress-induced IL6 drive lymphangiogenesis in bones. During lymphangiogenesis, secretion of CXCL12 from proliferating lymphatic endothelial cells is critical for hematopoietic and bone regeneration. Moreover, lymphangiocrine CXCL12 triggers expansion of mature Myh11+ CXCR4+ pericytes, which differentiate into bone cells and contribute to bone and hematopoietic regeneration. In aged animals, such expansion of lymphatic vessels and Myh11-positive cells in response to genotoxic stress is impaired. These data suggest lymphangiogenesis as a therapeutic avenue to stimulate hematopoietic and bone regeneration.

Keywords: 3D imaging; IL6; aging; bone; hematopoiesis; injury; lymphangiocrine; lymphatic vessels; regeneration; stress.


Conflict of interest statement

Declaration of interests The authors do not declare competing financial interests.

Figures

None
Graphical abstract
Figure 1
Figure 1
Light-sheet imaging of intact skeletal elements identifies lymphatic vessels in whole bones (A) Images of tibiae prior to and post-tissue clearing. 3D images were acquired on a light-sheet microscopy platform post-clearing with a high-magnification inset; labeled with the nuclear stain DAPI, immunostained with CD102 and α-SMA. (B) Murine knee joint prior to and after tissue clearing. 3D images of the knee joint; labeled with DAPI, α-SMA, and endomucin. (C) Murine femur immunostained with CD8α and α-SMA. (D) Murine cranium prior to and post-tissue clearing; immunolabeled with α-SMA, endomucin, and collagen I. (E) 3D images of the talocrural region with DAPI, α-SMA, and SOX9. (F) Images of the murine tarsal bones with DAPI, CD102, and perilipin. (G) Representative 3D images of human bone biopsy with DAPI, SM22α, and α-SMA. (H) 3D images of tibiae from young and aged mice with DAPI and LYVE1. (I) Schematic showing the image acquisition strategy on a light-sheet microscopy platform. 3D images of a tibia with LYVE1 and endomucin. Arrowheads, lymphatic vessels. (J) 3D image showing high-magnification inset of a murine tibia labeled with CD102, F4/80, and LYVE1. 3D image showing immunostaining for LYVE1, CD102, and osterix. Arrowheads, lymphatic vessels. (K) Representative 3D images of a murine tibia with F4/80 and LYVE1. (L) Image of a whole tibia showing DAPI, LYVE1, and CD102. Bone marrow, BM; cortical bone, CB. Scale bars: white, 500 μm; yellow, 50 μm. See also Figures S1, S2, and S3 and Videos S1 and S2.
Figure S1
Figure S1
3D and slice view images showing penetration of antibodies throughout the tissue and negative controls used during immunostaining for light-sheet imaging, related to Figure 1 (A) 3D image of a whole murine cleared tibia acquired on a light sheet microscopy platform showing α-SMA immunostaining (right panel). Images (left panels) display α-SMA immunostaining and antibody penetration throughout multiple layers in this tibia which consists of 537 layers with a total thickness of 3222 μm. Scale bar: 500 μm. (B) 3D image of a whole murine cleared tibia acquired on a light sheet microscopy platform showing CD102 immunostaining (right panel). Images (left panels) display CD102 immunostaining and antibody penetration throughout multiple layers through this tibia which consists of 608 layers and a thickness of 3648 μm. Scale bar: 500 μm. (C and D) Representative 3D images of whole murine tibial bones acquired on a light sheet microscope. Immunostaining was performed with primary antibodies for Collagen I (green), CD31 (red), and Endoglin (yellow) and Alexa fluor conjugated secondary antibodies - Alexa Fluor 488 (AF488: green), Alexa Fluor 546 (AF546: red) and Alexa Fluor 647 (AF647: yellow) in positive controls (C). In negative controls (D) primary antibodies not added and stained only with secondary antibodies - Alexa Fluor 488 (AF488: green), Alexa Fluor 546 (AF546: red), and Alexa Fluor 647 (AF647: yellow). Scale bars: 500 μm.
Figure S2
Figure S2
Immunostaining, clearing and multicolor panoptic light-sheet imaging of different intact murine bones, related to Figure 1 (A) Images of murine hip bones prior to (top-left panel) and post (top-right panel) tissue clearing. 3D images of the hip bones (center-left panels) with high magnification insets of the AC region (bottom-right panels); immunostained with CD102 (red), Collagen I (green) and Endoglin (cyan) (ilium: IL; ischium: IS; pubis: P and acetabulum: AC) with a surface overlay of the hip bone (gray). Scale bars: 800 μm and insets 150 μm (brown) and 200 μm (yellow). (B) 3D images of a murine incisor (left panels) with high magnification insets (right panels); labeled with DAPI, α-SMA, and Collagen I. Scale bars: 300 μm and insets 80 μm. (C) 3D images of murine metacarpal bones (left panels) with high magnification insets (right panels). Immunostaining for α-SMA (green) and Endomucin (red). Scale bars: 800 μm and insets 150 μm. (D) 3D image of the scapula with high magnification insets of the glenoid cavity (center-left and right panels: GA, glenoid cavity); immunolabeled with Collagen I, Endoglin and CD102. Scale bars: 500 μm and insets 80 μm.
Figure S3
Figure S3
3D imaging showing localization of lymphatic vessels in healthy murine bones, related to Figures 1 and 2 (A) 3D confocal image of a murine tibial bone labeled with DAPI and LYVE1. Arrowhead denotes the lymphatic vessels. Scale bar: 50 μm. (B) 3D images of murine tibial bones; labeled with DAPI, LYVE1 and Endomucin (metaphysis: MP; diaphysis: DP; cortical bone: CB; bone marrow: BM). Arrowheads: lymphatic vessels. Scale bar: 400 μm. (C) Representative 3D images with LYVE1 immunostaining of a whole murine tibial bone (total slice number, 713) showing the cortical region. Images in slice view show LYVE1 immunostaining across the cortical region of this whole bone. Note the distribution of LYVE1+ lymphatic vessels through the cortical region of the bone. Cortical bone: CB. Scale bar: 300 μm. (D) Representative 3D images of a whole murine tibial bone showing the marrow region (total slice number, 872). Images in slice view show LYVE1 immunostaining across the layers of bone marrow. Bone marrow: BM. Scale bar: 300 μm. (E) Representative 3D images (with 698 slices) with LYVE1 immunostaining of a whole murine femur showing the cortical region. Images showing slices across this cortical region of this whole bone. Note the distribution of LYVE1+ lymphatic vessels through the cortical region of the bone. Cortical bone: CB. Scale bar: 400 μm. (F) Representative 3D images of a whole murine femur bone showing the marrow region (total slice number, 664). Images in slice view show LYVE1 immunostaining across the layers of bone marrow. TOPRO-3 showed in magenta. Bone marrow: BM. Scale bars: 300 μm.
Figure 2
Figure 2
Distribution of lymphatic vessels in mouse and human bones (A) Images of a murine sternum prior to and post-tissue clearing and stained with DAPI, LYVE1, and CD102. (B) 3D images of a murine vertebral column labeled with DAPI, LYVE1, and CD102. (C) Costal bones with LYVE1 and CD102. (D) 3D images of a tibia showing immunostaining for LYVE1, PROX1, fibronectin, and CD8. Arrowheads indicate PROX1 and LYVE1 double-positive cells. (E) 3D images of tibiae from mice after the injection of Evans blue dye into the inner leg, medial to the tail, and footpad; DAPI and Evans blue dye. Arrowheads, Evans blue. (F) 3D image of a Lyve1 EGFP Cre adult (12 weeks old) mouse tibia; DAPI and LYVE1-EGFP. Arrowhead shows a lymphatic vessel. (G) Murine tibia with CD31, podoplanin, and DAPI labeling. Arrowhead, co-localization of podoplanin and CD31. (H) 3D images showing LYVE1-positive lymphatic vessels in BM versus CB. Arrowhead shows a lymphatic vessel. Quantification of lymphatic vessel density in CB and BM of murine tibiae (n = 7). (I) Quantification of lymphatic vessel diameter (n = 20). (J) Quantification of PROX1 concentration by ELISA (n = 12). (K) 3D images of human bone marrow biopsies from two donors with LYVE1 and DAPI. (L) UMAP projection of single cells from human bones showing different endothelial cell subsets, including the LECs (6). Heatmap showing PECAM1, LYVE1, FLT4, and PROX1 expressions in different endothelial cell subsets. Two-tailed unpaired t tests (nsp > 0.05 and ∗∗∗∗p < 0.0001). Scale bars: white, 500 μm; yellow, 50 μm. n represents biological replicates. Bone marrow, BM; metaphysis, MP; cortical bone, CB. See also Figures S3 and S4 and Video S2.
Figure S4
Figure S4
Analysis of lymphatic vessels and LECs in different bones, related to Figure 2 (A) 3D image of a murine calvarium showing DAPI (blue), LYVE1 (green), and CD31 (red). Scale bar: 600 μm. (B) 3D image of a murine tibial bone showing DAPI (blue), PROX1 (green) and CD31 (red). Arrowhead shows a lymphatic vessel. Scale bar: 300 μm. (C) Quantitative analysis of Prox1 mRNA expression in various bones - femur, skull, sternum and vertebral column as compared to tibia (mean ± SEM, n= 4 biological replicates). p values derived from two-tailed unpaired t-tests (nsp>0.05 and ∗∗∗∗p < 0.0001). (D) Relative fold mRNA expressions of Lyve1, Prox1, and Pdpn in mRNA isolated from the bones outer surface versus the isolated from the cortical region of the bones after processing for light sheet imaging (n = 11 biological replicates). Undetectable: UD. (E and F) Representative flow cytometry panels of lymphatic endothelial cells (LECs) isolated from various murine bones as gated (E) zombie-dye-, CD45, Podoplanin+ and LYVE1+. (F) Zombie-dye-, CD45, and LYVE1+ with back gating insets. (G) Violin Plots of single cells from human bone marrow presented the expression of PECAM1, LYVE1 and FLT4 genes in a single cluster. (H) UMAP projections showing LECs in the single cell suspension from human bone marrow.
Figure 3
Figure 3
Lymphatic vessels in bones drive hematopoietic regeneration (A) Schematic depicting the experimental design, whereby wild-type or Prox1 Cre ERT2X R26-td Tomato X iDTA mice were subjected to radiation prior to bone collection. In some cases, mice were additionally treated with a VEGFR3 inhibitor (SAR131675: I) immediately after radiation (R) and for every successive 48 h up until 10 days. (B) 3D images of tibiae showing LYVE1, CD102, and Ki67. Mice were subjected to radiation (R) or radiation along with SAR131675 (I) inhibitor treatment (R + I) compared with the unirradiated PBS-injected (sham) mice. Arrowheads, Ki67+ LECs. Quantification of lymphatic vessel density (n = 5). ELISA quantification of PROX1 concentration from R, R + I, and unirradiated PBS-treated (sham) mice (n = 6). (C) 3D images showing immunolabeling for LYVE1, PROX1, and fibronectin. Mice were subjected to radiation (R) or radiation along with SAR131675 (I) inhibitor treatment (R + I) and unirradiated PBS-injected (sham). Arrowheads, PROX1 and LYVE1 double-positive cells. (D) 3D images of tibiae with LYVE1 from 5-fluorouracil (5-FU) or 5-FU along with SAR131675 (I) inhibitor (5-FU + I)-treated mice compared to PBS-injected (sham) mice. Quantification of lymphatic vessel density in these mice (n = 5). ELISA quantification of PROX1 concentration in tibiae from 5-FU, 5-FU + I, and sham mice (n = 6). (E) Bone marrow (BM) cellularity, number of LSK cells, and HSCs in bones from radiation (R) and radiation along with SAR131675 (I) inhibitor (R + I)-treated mice. Analysis was performed at 4, 14, and 29 days post-radiation and BM transplantation (n = 6). (F) 1 × 106 donor BM cells from radiation (R) or radiation along with SAR131675 (I) inhibitor (R + I)-treated mice (as detailed in E) were transplanted into secondary wild-type recipient mice (n = 6). Overall, myeloid, B cells, and T cells reconstitution were assessed at 4, 8, 12, and 16 week post-radiation and BM transplantation. (G) 3D images showing LYVE1 or Tomato and DAPI from Cre iDTA and Cre+ iDTA; Prox1 Cre ERT2X R26-td Tomato X iDTA mice subjected to radiation. Quantification of lymphatic vessel density in bones from Cre iDTA and Cre+ iDTA mice subjected to radiation (n = 5). ELISA quantification of PROX1 concentration (n = 6). (H) Bone marrow cellularity, number of LSK cells, and HSCs in bones from Cre iDTA and Cre+ iDTA, Prox1 Cre ERT2X iDTA mice were analyzed at 4, 14, and 29 days post-radiation and BM transplantation (n = 6). (I) 1 × 106 donor BM cells from Cre iDTA or Cre+ iDTA, Prox1 Cre ERT2X iDTA primary donor mice (as detailed in H) were transplanted into secondary wild-type recipient mice. Overall, myeloid, B cells, and T cells reconstitution were assessed at 4, 8, 12, and 16 week post-radiation and BM transplantation (n = 6 overall, myeloid, and B cells; n = 5 for T cells). (J) Frequency of HSCs in Prox1 Cre ERT2X iDTA bones from Cre iDTA and Cre+ iDTA mice (n = 5). Frequency of HSCs in SAR131675 inhibitor-treated wild-type mice compared to PBS-injected (sham) mice (n = 5). One-way ANOVA tests with Tukey’s multiple comparisons tests ( B and D); two-way ANOVA with Sidak multiple comparisons tests (E, F, H, and I); two-tailed unpaired t tests (G and J). nsp > 0.05, p < 0.05, ∗∗p < 0.01, ∗∗∗p < 0.001, and ∗∗∗∗p < 0.0001. Scale bars: white, 500 μm; yellow, 100 μm. n represents biological replicates. See also Figure S5.
Figure S5
Figure S5
Analysis of lymphatic endothelium during genotoxic stress, related to Figures 3 and 4 (A) High magnification images demonstrating LYVE1 (red) staining of the tibia in healthy mice (sham) or mice subjected to radiation. Scale bar: 200 μm. (B) Quantification of lymphatic vessel density in tibial bones from mice treated with radiation compared to unirradiated sham (n = 7 biological replicates). Cortical bone: CB and bone marrow: BM. Statistical significance between each group was determined using two-tailed unpaired t-tests (∗∗∗∗p < 0.0001). (C) Representative 3D images of tibial bones from radiation and 5-FU treated mice showing CD45 (violet) and LYVE1 (green). Arrowheads denote the lymphatic vessels (cortical bone: CB and bone marrow: BM). Scale bar: 300 μm. (D) Confocal image of a murine tibia immunolabeled with CD45 (red), LYVE1 (green), and CD11b (cyan). Arrowheads denote the lymphatic vessels (bone marrow: BM). Scale bar: 200 μm. (E) Representative image of a murine tibia showing immunostaining for CD45 (red) and LYVE1 (green). Arrowheads indicate the lymphatic vessels (bone marrow: BM). Scale bar: 200 μm. (F) 3D image of a murine tibia showing immunostaining for CD45 (cyan), LYVE1 (green), and PROX1 (red). Arrowhead: lymphatic vessels (bone marrow: BM). Scale bar: 150 μm. (G) Quantification of lymphatic vessel density in tibial bones from mice were analyzed at 0-, 15-, 25-, 35-, 45-, and 55 days of post-radiation (n = 5 biological replicates). p values derived from two-tailed unpaired t-tests (nsp>0.05). (H) Relative fold tomato mRNA expression in tibial bones from unirradiated (sham), radiation (R) treated or radiation with SAR131675 (I) inhibitor treated (R + I) mice (n = 6 biological replicates). Undetectable; UD. p values derived from two-tailed unpaired t-tests (nsp>0.05). (I) Quantification of lymphatic vessel density in tibial bones from unirradiated (sham), radiation treated (R) and radiation along with IL6R blocking antibody (R + IL6R-block) treated mice, (n = 7 biological replicates). p values derived from one-way ANOVA tests with Tukey’s multiple comparisons tests (∗∗∗∗p < 0.0001). (J) Relative fold mRNA expression of Il18, Il27 and Il7 in tibial bones from radiation treated mice compared to unirradiated sham mice (n = 6 biological replicates). p values derived from two-tailed unpaired t-tests (∗∗∗∗p < 0.0001). (K) ELISA quantification of PROX1 concentration in tibial bones from radiation (R) only mice as compared to radiation along with blocking (block) antibodies for IL6 (R + IL6-block), IL18 (R + IL18-block), IL27 (R + IL27-block) and IL7 (R + IL7-block) (n = 6 biological replicates). Statistical significance between each group was determined using two-tailed unpaired t-tests (nsp>0.05 and ∗∗∗∗p < 0.0001).
Figure 4
Figure 4
Injury-induced IL6 drives lymphangiogenesis in bone, and lymphangiocrine CXCL12 is required for hematopoietic regeneration (A) Relative fold mRNA expression of Il6 and IL6 concentration in bones from radiation-treated and unirradiated (sham) mice (n = 5). (B) Tibiae showing LYVE1 immunostaining in IL6-knockout (KO) or IL6-KO + radiation (R) or IL6-KO + R + IL6-treated mice relative to wild-type (WT) mice. Quantification of lymphatic vessel density in these mice (n = 5). Quantification of lymphatic vessel density in tibiae from IL6-KO or IL6-KO + 5-fluorouracil (5-FU) or IL6-KO + 5-FU + IL6-treated mice relative to WT mice (n = 5). (C) Bone marrow cellularity, number of LSK cells, and HSCs in bones from IL6-KO or WT mice were analyzed at 4, 14, and 29 days post-radiation and BM transplantation (n = 6). (D) 1 × 106 donor BM cells from WT or IL6-KO primary donor mice (as detailed in C) were transplanted into secondary WT recipient mice. Overall, myeloid, B cells, and T cells reconstitution were assessed at 4, 8, 12, and 16 week post-radiation and BM transplantation (n = 6 for overall, myeloid, and B cells; n = 5 for T cells). (E) Relative fold mRNA expression of Angp1, Kitl, Vcam1, II7, Wnt1, Wnt3a, and Cxcl12 in purified bone LECs isolated from mice treated with radiation compared to unirradiated (sham) mice (n = 5). (F) Representative 3D images of tibiae from CXCL12-EGFP mice 10 days post-radiation. CXCL12 concentration was quantified in Prox1 Cre ERT2X iDTA bones from Cre iDTA and Cre+ iDTA mice after radiation (n = 5) and irradiated (R) WT and IL6-KO mice (n = 5). (G) Frequency of HSCs in unirradiated bones from Cre and Cre+, Prox1 Cre ERT2X Cxcl12fl/fl mice (n = 5). Analysis was performed 29 days post-tamoxifen injections in Cre and Cre+ mice. (H) Bone marrow cellularity, number of LSK cells, and HSCs in bones from Prox1 Cre ERT2X Cxcl12fl/fl mice. Cre+ and Cre mice were analyzed at 4, 14, and 29 days post-radiation and BM transplantation (n = 6). (I) 1 × 106 donor BM cells from Prox1 Cre ERT2X Cxcl12fl/fl, Cre+ or Cre primary donor mice (as detailed in H) were transplanted into secondary WT recipient mice. Overall, myeloid, B cells, and T cells reconstitution were assessed at 4, 8, 12, and 16 week post-radiation and BM transplantation (n = 6 for overall, myeloid, and B cells; n = 5 for T cells). Two-tailed unpaired t tests (A, E, F, and G); one-way ANOVA with Tukey’s multiple comparisons tests (B); two-way ANOVA with Sidak multiple comparisons tests (C, D, H, and I). nsp > 0.05, p < 0.05, ∗∗p < 0.01, ∗∗∗p < 0.001, and ∗∗∗∗p < 0.0001. Scale bars: white, 500 μm; yellow, 80 μm. n represents biological replicates. See also Figures S5 and S6.
Figure S6
Figure S6
Quantification of hematopoietic cells, expression of osteogenic markers in steady-state Prox1 Cre ERT2X Cxcl12fl/fl mice and lineage tracing of Myh11+ pericytes across different organs, related to Figures 4 and 5 (A) Bone marrow cellularity (left panel), number of LSK cells (center-left panel), myeloid (center-right panel) and erythroid (right panel) in Cre+ and Cre, Prox1 Cre ERT2X Cxcl12fl/fl mice bones were analyzed at steady state (n = 6 biological replicates for cellularity and LSK; n = 5 biological replicates for myeloid and erythroid). Analysis was performed 29 days post-tamoxifen injections in Cre+ mice and Cre littermate controls. These analyses were performed at steady state/homeostasis. Statistical significance between each group was determined using two-tailed unpaired t-tests (nsp>0.05). (B) Relative fold mRNA expression of Sp7, Ibsp and Bglap in tibial bones from Cre+Prox1 Cre ERT2X Cxcl12fl/fl compared with their Cre littermate controls. These analyses were performed at steady state/homeostasis (n = 7 biological replicates). Analysis was performed 29 days post-tamoxifen injections in Cre and Cre+ mice. p values derived from two-tailed unpaired t-tests (nsp>0.05). (C) Schematic depicting the experimental design, whereby tamoxifen-inducible Myh11 Cre ERT2X R26-td Tomato mice, were subjected to radiation 7 days post-tamoxifen administration, and organs were subsequently collected and stained 10 days post-radiation treatment. (D-F) Confocal images of (D) lung, (E) kidney, and (F) liver tissues from Myh11 Cre ERT2X R26-td Tomato, organs from radiation treated (right panels) and unirradiated sham (left panels) mice; Tomato (red), Endomucin (green) and DAPI (blue). Scale bars: 50 μm.
Figure 5
Figure 5
Lymphatic vessels drive bone regeneration via Myh11-positive pericytes (A) Relative fold mRNA expression of Sp7, Ibsp, and Bglap in wild-type mice treated with radiation- and SAR131675-treated compared to sham mice treated with radiation alone (n = 5). Relative fold mRNA expressions in radiation-treated Prox1 Cre ERT2X iDTA; Cre+ iDTA mice relative to their Cre iDTA littermate control mice (n = 5). (B) Bone formation rate per bone surface (BFR/BS) in radiation-treated Cre iDTA and Cre+ iDTA, Prox1 Cre ERT2X iDTA mice; calcein (green). Data represent mean ± SEM (n = 5). (C) Representative μ-CT images of tibiae from radiation-treated Cre iDTA and Cre+ iDTA, Prox1 Cre ERT2X iDTA mice. Quantitative analysis of relative bone volume (Rel. BV.) and cortical thickness (Ct. Th.) of tibiae (n = 5). (D) Schematic depicting the experimental design, whereby various tamoxifen-inducible Cre mouse strains were subjected to radiation 1 week post-tamoxifen, and tibiae were subsequently collected at 10 days post-radiation. In some cases, mice were additionally treated with a VEGFR3 inhibitor (SAR131675: I) immediately after radiation and for every successive 48 h up until 10 days. (E) 3D images of tibiae showing Tomato and TOPRO-3 from Myh11 Cre ERT2X R26-td Tomato mice treated with radiation (R), radiation along with SAR131675 (I) inhibitor (R + I), and unirradiated PBS-treated (sham) mice with a high-magnification inset. Quantification of Tomato-positive cells in the bones from Myh11 Cre ERT2X R26-td Tomato mice (n = 5). (F) 3D images of tibiae from unirradiated sham and radiation-treated mice with Tomato, collagen I, and TOPRO-3. (G) 3D images of tibiae with Tomato, endomucin (Emcn), and TOPRO-3 from unirradiated sham and radiation-treated mice with high-magnification insets from growth plate regions. (H) 3D images of tibiae showing Tomato, perilipin, and TOPRO-3 from unirradiated sham and radiation-treated mice with high-magnification insets. (I) Schematic depicting the experimental design, whereby both Cre+ and Cre, Myh11 Cre ERT2X R26-td Tomato mice were subjected to tamoxifen treatment at postnatal day 1, and tibiae were subsequently collected after 10 days. Representative 3D images of a Cre+ tibia showing Tomato expresssion pattern. (J) Schematic depicting the experimental design, whereby various tamoxifen-inducible Myh11 Cre ERT2X R26-td Tomato X iDTA mice were subjected to radiation 1 week post-tamoxifen treatment, and tibiae were subsequently collected at 10 days or 20 days post-radiation. 3D images from radiation-treated Cre iDTA or Cre+ iDTA mice; labeled with osteopontin and osteocalcin. Relative fold mRNA expression of Sp7, Ibsp, and Bglap in Myh11 Cre ERT2X R26-td Tomato X iDTA mice treated with radiation; Cre+ iDTA mice as compared to their Cre iDTA littermate control mice (n = 5). (K) 3D μ-CT images of tibiae from radiation-treated Cre iDTA and Cre+ iDTA, Myh11 Cre ERT2X iDTA mice. Analysis of relative bone volume (Rel. BV.) and cortical thickness (Ct. Th.) of tibiae (n = 5). (L) 3D image of a tibiae from Myh11 Cre ERT2X R26-td Tomato mice showing Tomato and CXCR4 in bone marrow (BM). Arrowheads, Tomato and CXCR4 double-positive cells. (M) 3D images of a tibia from Myh11 Cre ERT2X R26-td Tomato mice showing Tomato, CXCR4, and DAPI. Quantification of Tomato-positive cells from the CXCL12-treated and PBS-injected (sham) mice (n = 6). Arrowhead showing Tomato and CXCR4 double-positive cells. Two-tailed unpaired t tests (A–C, J, K, and M); one-way ANOVA tests with Tukey’s multiple comparisons tests (E). ∗∗p < 0.01, ∗∗∗p < 0.001, and ∗∗∗∗p < 0.0001. Scale bars: white, 50 μm; yellow, 10 μm. n represents biological replicates. See also Figures S6, S7, and S8.
Figure S7
Figure S7
Lineage tracing of various mesenchymal cells in bones during homeostasis and genotoxic stress, related to Figure 5 (A) Schematic depicting the experimental design, whereby various tamoxifen-inducible Cre mouse strains were subjected to radiation 1-week post-tamoxifen treatment. At the end of the radiation (R), the mice received an injection of the VEGFR3 inhibitor (SAR131675: I), and tibial bones were subsequently collected and stained for imaging. All experiments were performed with n = 6 biological replicates. (B) Immunostaining of the murine tibial bones of Pdgfrβ Cre ERT2X R26-td Tomato, healthy mice (sham) or mice subjected to radiation; Tomato (red) and TOPRO-3 (blue). Quantification of Tomato+ cells in tibial bones from R, R + I, and unirradiated PBS treated sham Pdgfrβ Cre ERT2X R26-td Tomato mice. Scale bars: 300 μm. (C) Immunostaining of the murine tibial bones of Gli1 Cre ERT2X R26-td Tomato, unirradiated mice (sham) or mice subjected to radiation with high magnification insets; Tomato (red), Collagen I (green), Endomucin (white), and TOPRO-3 (blue). Scale bars: 300 μm and insets 50 μm. (D) Immunostaining of the murine tibial bones of Gli1 Cre ERT2X R26-td Tomato, unirradiated mice (sham) or mice subjected to radiation; Tomato (red), Endomucin (green), TOPRO-3 (blue) and Perilipin (white). Quantification of Tomato+ cells from Gli1 Cre ERT2X R26-td Tomato mice. Scale bars: 50 μm (upper panels); 500 μm (lower panel) and insets 50 μm (yellow and blue) or 10 μm (green and red). (E) Immunostaining of the murine tibial bones of AdipoQ Cre ERT2X R26-td Tomato unirradiated mice (sham) or mice subjected to radiation; Tomato (red) and TOPRO-3 (blue). Quantification of Tomato+ cells from AdipoQ Cre ERT2X R26-td Tomato mice. Scale bars: 500 μm. (F) Immunostaining of the murine tibial bones of Cspg4 Cre ERT2X R26-td Tomato unirradiated mice (sham, top-left or center panel) or mice subjected to radiation (bottom-left and right panel); Tomato (red), Endomucin (green) and TOPRO-3 (blue). Bar graph shows the quantification of Tomato+ cells from Cspg4 Cre ERT2X R26-td Tomato mice. Scale bars: 50 μm (left) and 500 μm (right). (B-F) p values derived from one-way ANOVA tests with Tukey’s multiple comparisons tests (n= 5). (nsp>0.05 and ∗∗∗∗p < 0.0001).
Figure 6
Figure 6
Age-dependent changes in LECs in homeostasis and during genotoxic stress (A) Fluorescence-activated cell sorting (FACS) quantification of Myh11-positive and CXCR4+ cells in Cre and Cre+, Prox1 Cre ERT2X Cxcl12fl/fl mice (n = 6). (B) 3D images of tibiae from unirradiated (sham) and radiation-treated Myh11 Cre ERT2X R26-td Tomato mice showing Tomato, NG2, endomucin, and collagen I. Dashed lines indicate the endosteal regions of the bone. Arrowheads, Tomato-positive cells. (C) Confocal images of tibiae from unirradiated (sham) and radiation-treated Myh11 Cre ERT2X R26-td Tomato mice showing osterix, Tomato, and DAPI. Dashed lines denote the endosteal regions of the bone. Arrowheads, Tomato-positive cells. (D) μ-CT images of tibiae from radiation treated Cre and Cre+, Prox1 Cre ERT2X Cxcl12fl/fl mice. Quantitative analysis of relative bone volume (Rel. BV.) and cortical thickness (Ct. Th.) of the bones (n = 5). (E) Relative fold mRNA expression of Sp7, Ibsp, and Bglap in radiation-treated Cre+, Prox1 Cre ERT2X Cxcl12fl/fl mice compared to their Cre littermate controls (n = 6). (F) Quantification of lymphatic vessel density in tibiae from young and aged mice during homeostasis and after radiation (n = 5). (G) Quantification of lymphatic vessel density in tibiae from aged mice treated with radiation compared to unirradiated (sham) mice (n = 5). ELISA quantification of PROX1 concentration in tibiae from aged mice treated with radiation compared to unirradiated (sham) mice (n = 6). (H) Quantification of lymphatic vessel density in tibiae from aged mice treated with 5-FU compared to sham mice (n = 5). ELISA quantification of PROX1 concentration in tibiae from aged mice treated with 5-FU compared to PBS-injected sham mice (n = 6). (I) Relative fold mRNA expression of Cxcl12 in purified lymphatic endothelial cells (LECs) isolated from bones in aged mice treated with radiation compared to unirradiated (sham) mice (n = 7). (J) 3D images of tibiae from Myh11 Cre ERT2X R26-td Tomato mice treated with radiation compared to unirradiated (sham) mice; showing Tomato and endomucin. (K) Quantification of Tomato-positive cells in tibiae from young and aged Myh11 Cre ERT2X R26-td Tomato mice after radiation (n = 5). (L) Relative fold mRNA expression of Vegfr3, Ki67, p16, and p21 in purified LECs isolated from young (Y-LECs) and aged (A-LECs) murine tibiae (n = 6). (M) Schematic depicting the experimental design, whereby aged mice were administered with purified A-LECs or Y-LECs followed by the radiation. Bones were analyzed post-radiation at day 15 to day 40. (N) 3D images of tibiae from Myh11 Cre ERT2X R26-td Tomato aged mice transplanted with A-LECs or Y-LECs and subsequently subjected to radiation (as detailed in M) showing Tomato and DAPI. Arrowheads show the expansion of Tomato-positive cells in aged mice transplanted with Y-LECs. Quantification of Tomato-positive cells in aged bones isolated from mice transplanted with A-LECs and Y-LECs (n = 5). (O) 3D images of aged mice tibiae after A-LECs or Y-LECs transplantation and radiation showing immunostaining for collagen I, endomucin, and osterix. (P) 3D images of tibiae from aged mice with the transplantation of A-LECs or Y-LECs and radiation showing immunostaining for osteocalcin. Nuclei were stained with DAPI. Relative fold mRNA expression of Sp7, Ibsp, and Bglap in tibia from irradiated mice transplanted with Y-LECs as compared to the mice transplanted A-LECs (n = 7). (Q) Analysis of relative bone volume (Rel. BV.) and cortical thickness (Ct. Th.) in aged mice subjected to radiation and transplanted with A-LECs or Y-LECs (n = 6). (R) Bone marrow cellularity, number of LSK cells, and HSCs in bones from aged mice transplanted with A-LECs or Y-LECs after radiation. Analyses were performed at 4, 14, and 29 days post-transplantation (n = 6). Two-tailed unpaired t tests (A, D–I, K, L, N, P, and Q); two-way ANOVA with Sidak multiple comparisons tests (R). nsp > 0.05, ∗∗p < 0.01, ∗∗∗p < 0.001, and ∗∗∗∗p < 0.0001. Scale bars: white, 300 μm; yellow, 30 μm. n represents biological replicates. Bone marrow, BM; cortical bone, CB. See also Figure S8.
Figure S8
Figure S8
Lineage tracing and analysis of Myh11+ pericytes and LECs in homeostasis versus genotoxic stress in bones, related to Figures 5 and 6 (A) Representative 3D images of tibial bones from Myh11 Cre ERT2X R26-td Tomato mice showing Tomato (red), PDGFRβ (green, left panels), and FSP1 (green, right panels), Nuclei were stained with TOPRO-3 (blue). Arrowheads show the adipocyte forming Tomato+ cells. Scale bars: 15 μm (left) and 10 μm (right). (B) Bone marrow (BM) cellularity (left panel), number of LSK cells (center panel) and HSCs (right panel) in tibial bones from Cre iDTA and Cre+ iDTA, Myh11 Cre ERT2X iDTA mice were analyzed at 4-, 14- and 29- days post-radiation treatment and BM transplantation (n = 6 biological replicates). Statistical significance between each group was determined using two-way ANOVA with Sidak multiple comparisons tests (p < 0.05, ∗∗p < 0.01, ∗∗∗p < 0.001 and ∗∗∗∗p < 0.0001). (C) 1 x 10⁶ donor BM cells from Cre iDTA and Cre+ iDTA, Myh11 Cre ERT2X iDTA treated primary donor mice (as detailed in B) were transplanted into secondary wild type recipient mice 4 weeks after radiation treatment. Overall (left panel), myeloid (center-left panel), B cells (center-right panel) and T cells (right panel) reconstitution were assessed at 4-, 8-, 12- and 16-week post-radiation treatment and BM transplantation (n = 6 biological replicates for overall, myeloid and B cells; n = 5 biological replicates for T cells). Statistical significance between each group was determined using two-way ANOVA with Sidak multiple comparisons tests (nsp>0.05, ∗∗p < 0.01, ∗∗∗p < 0.001 and ∗∗∗∗p < 0.0001). (D) FACS quantification of Annexin V+ LECs (top panel) in unirradiated versus irradiated mice. (n = 7 biological replicates). p value derived from a two-tailed unpaired t-test (nsp>0.05). Further, FACS quantification of Ki67+ LECs (bottom panel) in unirradiated versus irradiated mice (n = 7 biological replicates). p value derived from a two-tailed unpaired t-test (∗∗∗∗p < 0.0001). (E) Schematic depicting the experimental design, whereby Lyve1 EGFP Cre X R26-td Tomato mice were generated. Bones were collected for analysis at the age of 10-12 weeks at steady state. Representative 3D images of the tibial bone showing Tomato (red), LYVE1-EGFP (green), Endomucin immunostaining (cyan), and nuclear staining with DAPI (blue). Arrowheads indicate Tomato positive type H vessels in the metaphysis (MP) region of the bone. Note the tomato expression in type H vessels in metaphysis but not in the sinusoidal vessels in diaphysis. Growth plate: GP; diaphysis: DP. Scale bar: 50 μm. (F) Schematic depicting the experimental design, whereby Lyve1 EGFP Cre X R26-td Tomato mice were subjected to radiation prior to bone collection. 3D images showing Tomato (red), LYVE1-EGFP (green), Podoplanin (white) and DAPI (blue). Yellow arrowheads indicate the Tomato and LYVE1-EGFP double-positive cells. White arrowheads show LYVE1-EGFP positive but Tomato negative cells. (Metaphysis: MP; bone marrow: BM). Scale bar: 150 μm. (G) FACS quantification of LYVE1-EGFP- Tomato+ cells and LYVE1-EGFP+ Tomato+ in tibial bones from Lyve1 EGFP Cre X R26-td Tomato unirradiated mice versus mice subjected to radiation treatment (n = 7 biological replicates). p value derived from a two-tailed unpaired t-test (∗∗∗∗p < 0.0001).

Comment in

  • Lymphatic vessels identified in bones.
    Schwaerzer G. Schwaerzer G. Nat Cardiovasc Res. 2023 Mar;2(3):223. doi: 10.1038/s44161-023-00255-5. Nat Cardiovasc Res. 2023. PMID: 39196023 No abstract available.

References

    1. Kopp H.G., Avecilla S.T., Hooper A.T., Rafii S. The bone marrow vascular niche: home of HSC differentiation and mobilization. Physiology. 2005;20:349–356. doi: 10.1152/physiol.00025.2005. - DOI - PubMed
    1. Guo P., Poulos M.G., Palikuqi B., Badwe C.R., Lis R., Kunar B., Ding B.S., Rabbany S.Y., Shido K., Butler J.M., Rafii S. Endothelial jagged-2 sustains hematopoietic stem and progenitor reconstitution after myelosuppression. J. Clin. Invest. 2017;127:4242–4256. doi: 10.1172/jci92309. - DOI - PMC - PubMed
    1. Stegen S., Carmeliet G. The skeletal vascular system - Breathing life into bone tissue. Bone. 2018;115:50–58. doi: 10.1016/j.bone.2017.08.022. - DOI - PubMed
    1. Maes C., Carmeliet G., Schipani E. Hypoxia-driven pathways in bone development, regeneration and disease. Nat. Rev. Rheumatol. 2012;8:358–366. doi: 10.1038/nrrheum.2012.36. - DOI - PubMed
    1. Ramasamy S.K., Kusumbe A.P., Schiller M., Zeuschner D., Bixel M.G., Milia C., Gamrekelashvili J., Limbourg A., Medvinsky A., Santoro M.M., et al. Blood flow controls bone vascular function and osteogenesis. Nat. Commun. 2016;7:13601. doi: 10.1038/ncomms13601. - DOI - PMC - PubMed

Publication types

LinkOut - more resources