. 2023 Jan 19;83(2):186-202.e11.
doi: 10.1016/j.molcel.2022.12.022.

PGC-1α senses the CBC of pre-mRNA to dictate the fate of promoter-proximally paused RNAPII

Affiliations

PGC-1α senses the CBC of pre-mRNA to dictate the fate of promoter-proximally paused RNAPII

Xavier Rambout et al. Mol Cell. .

Abstract

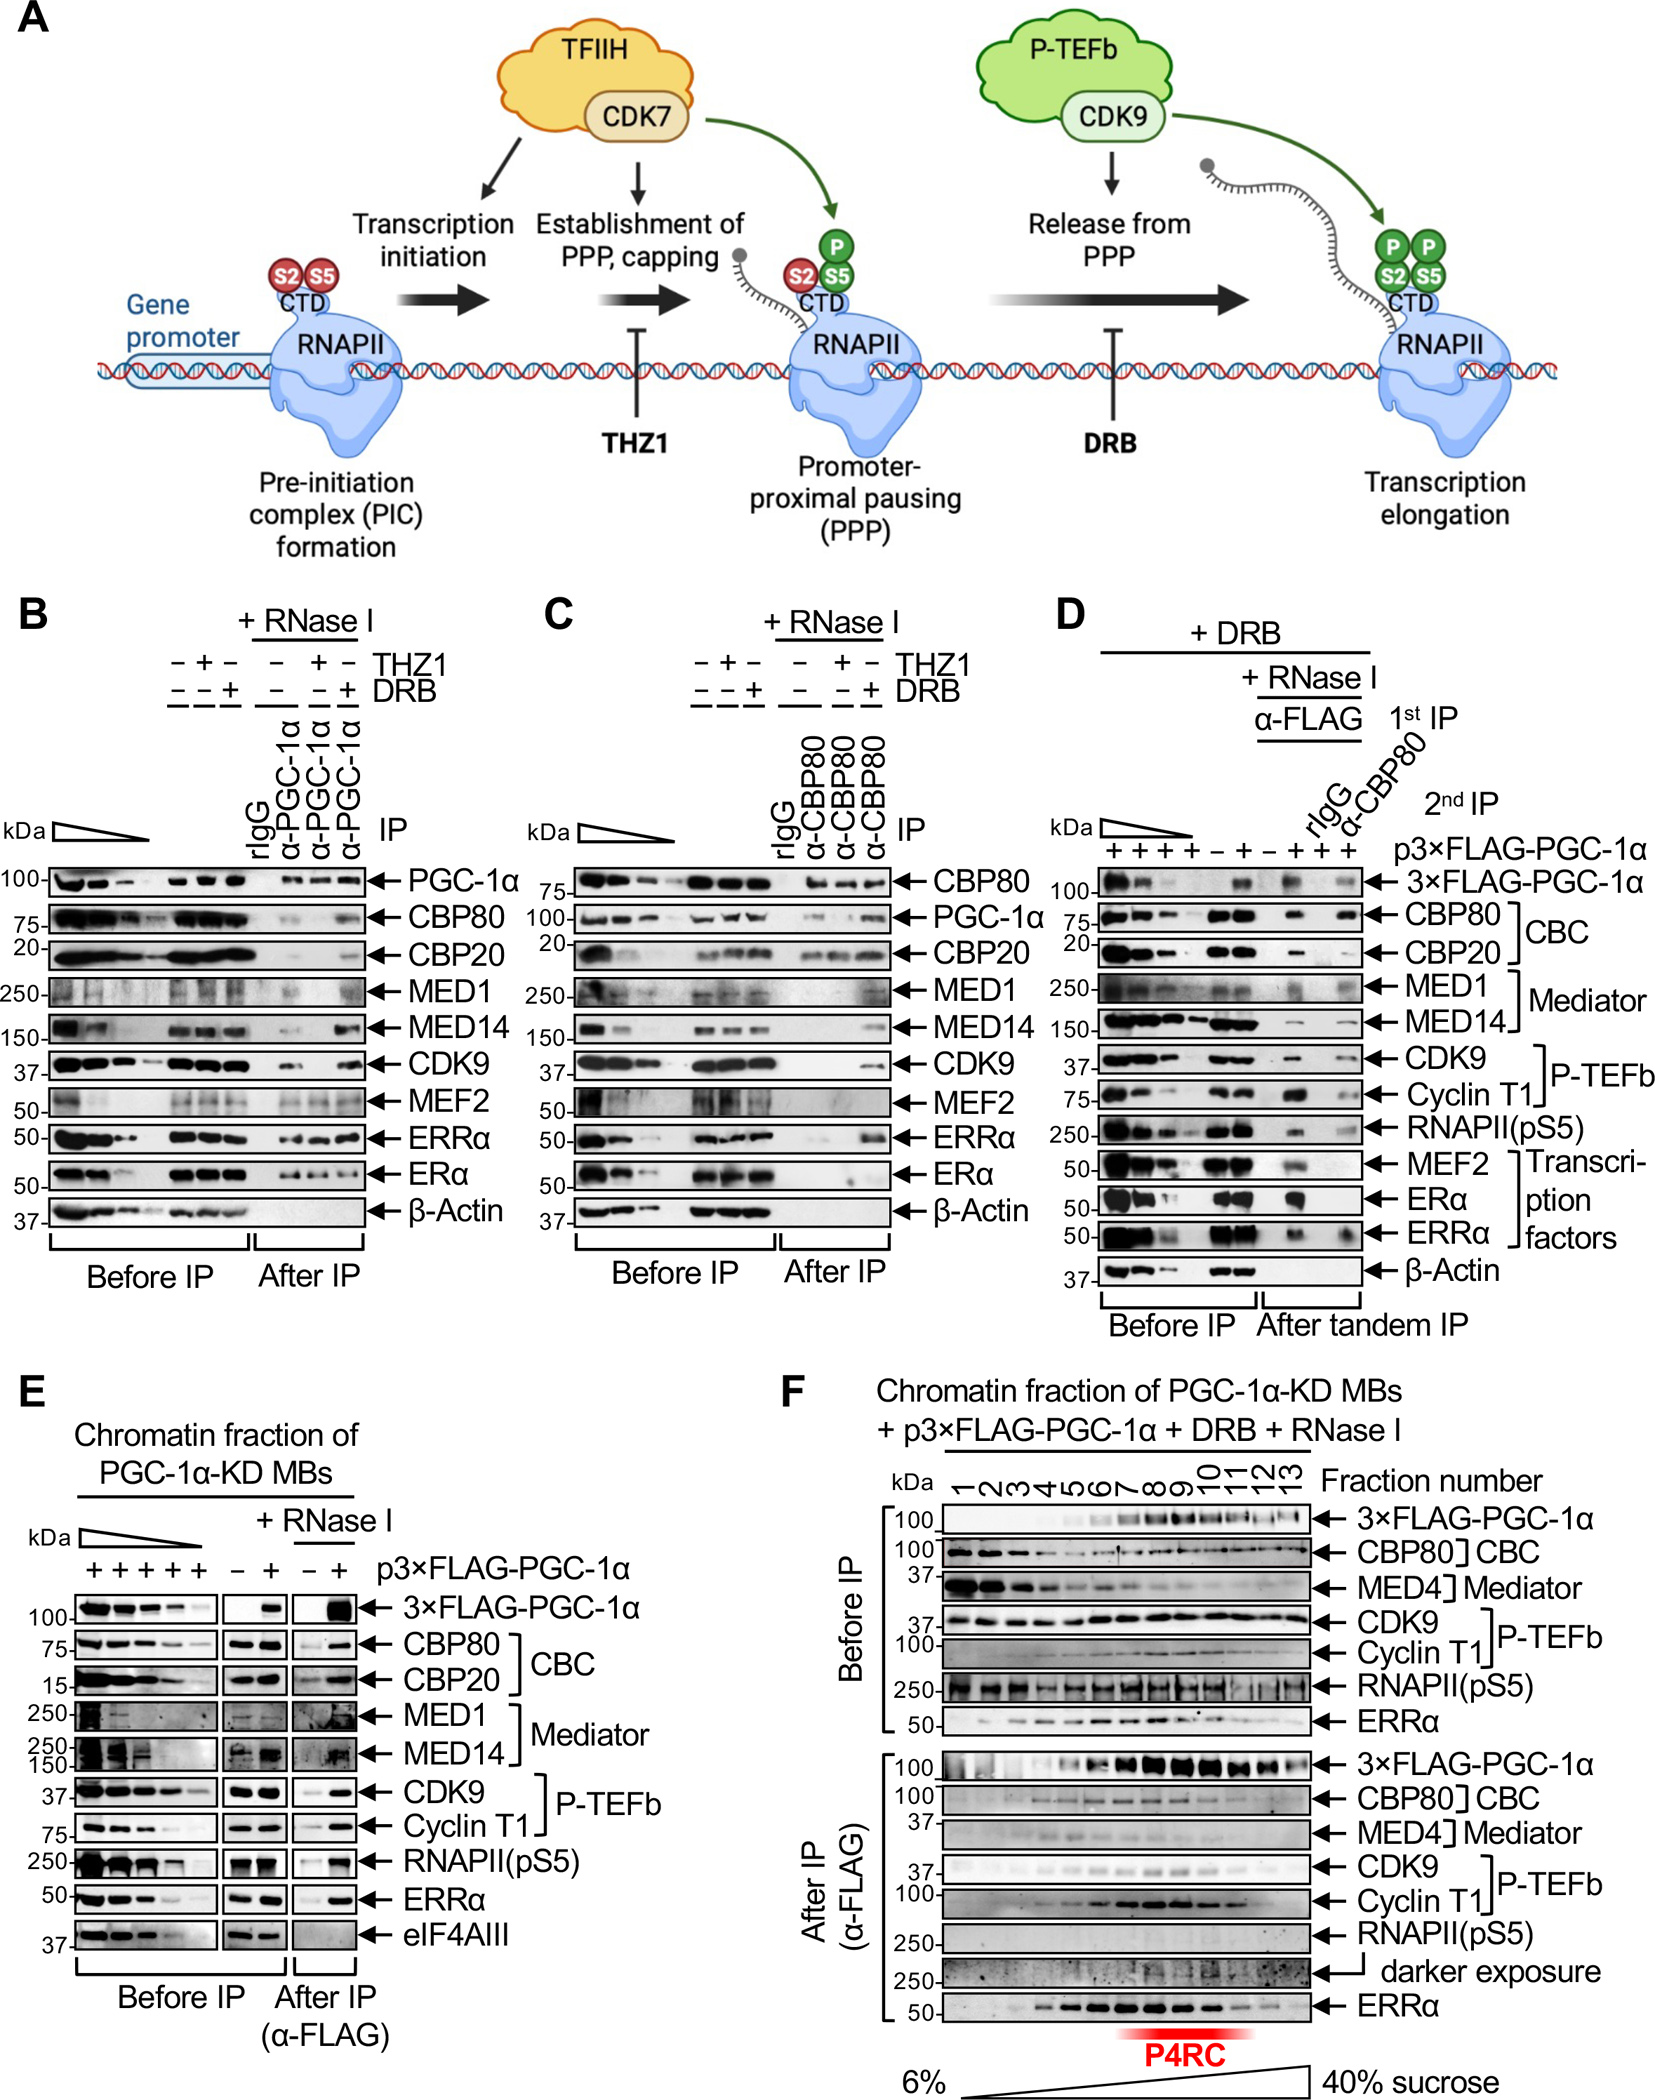
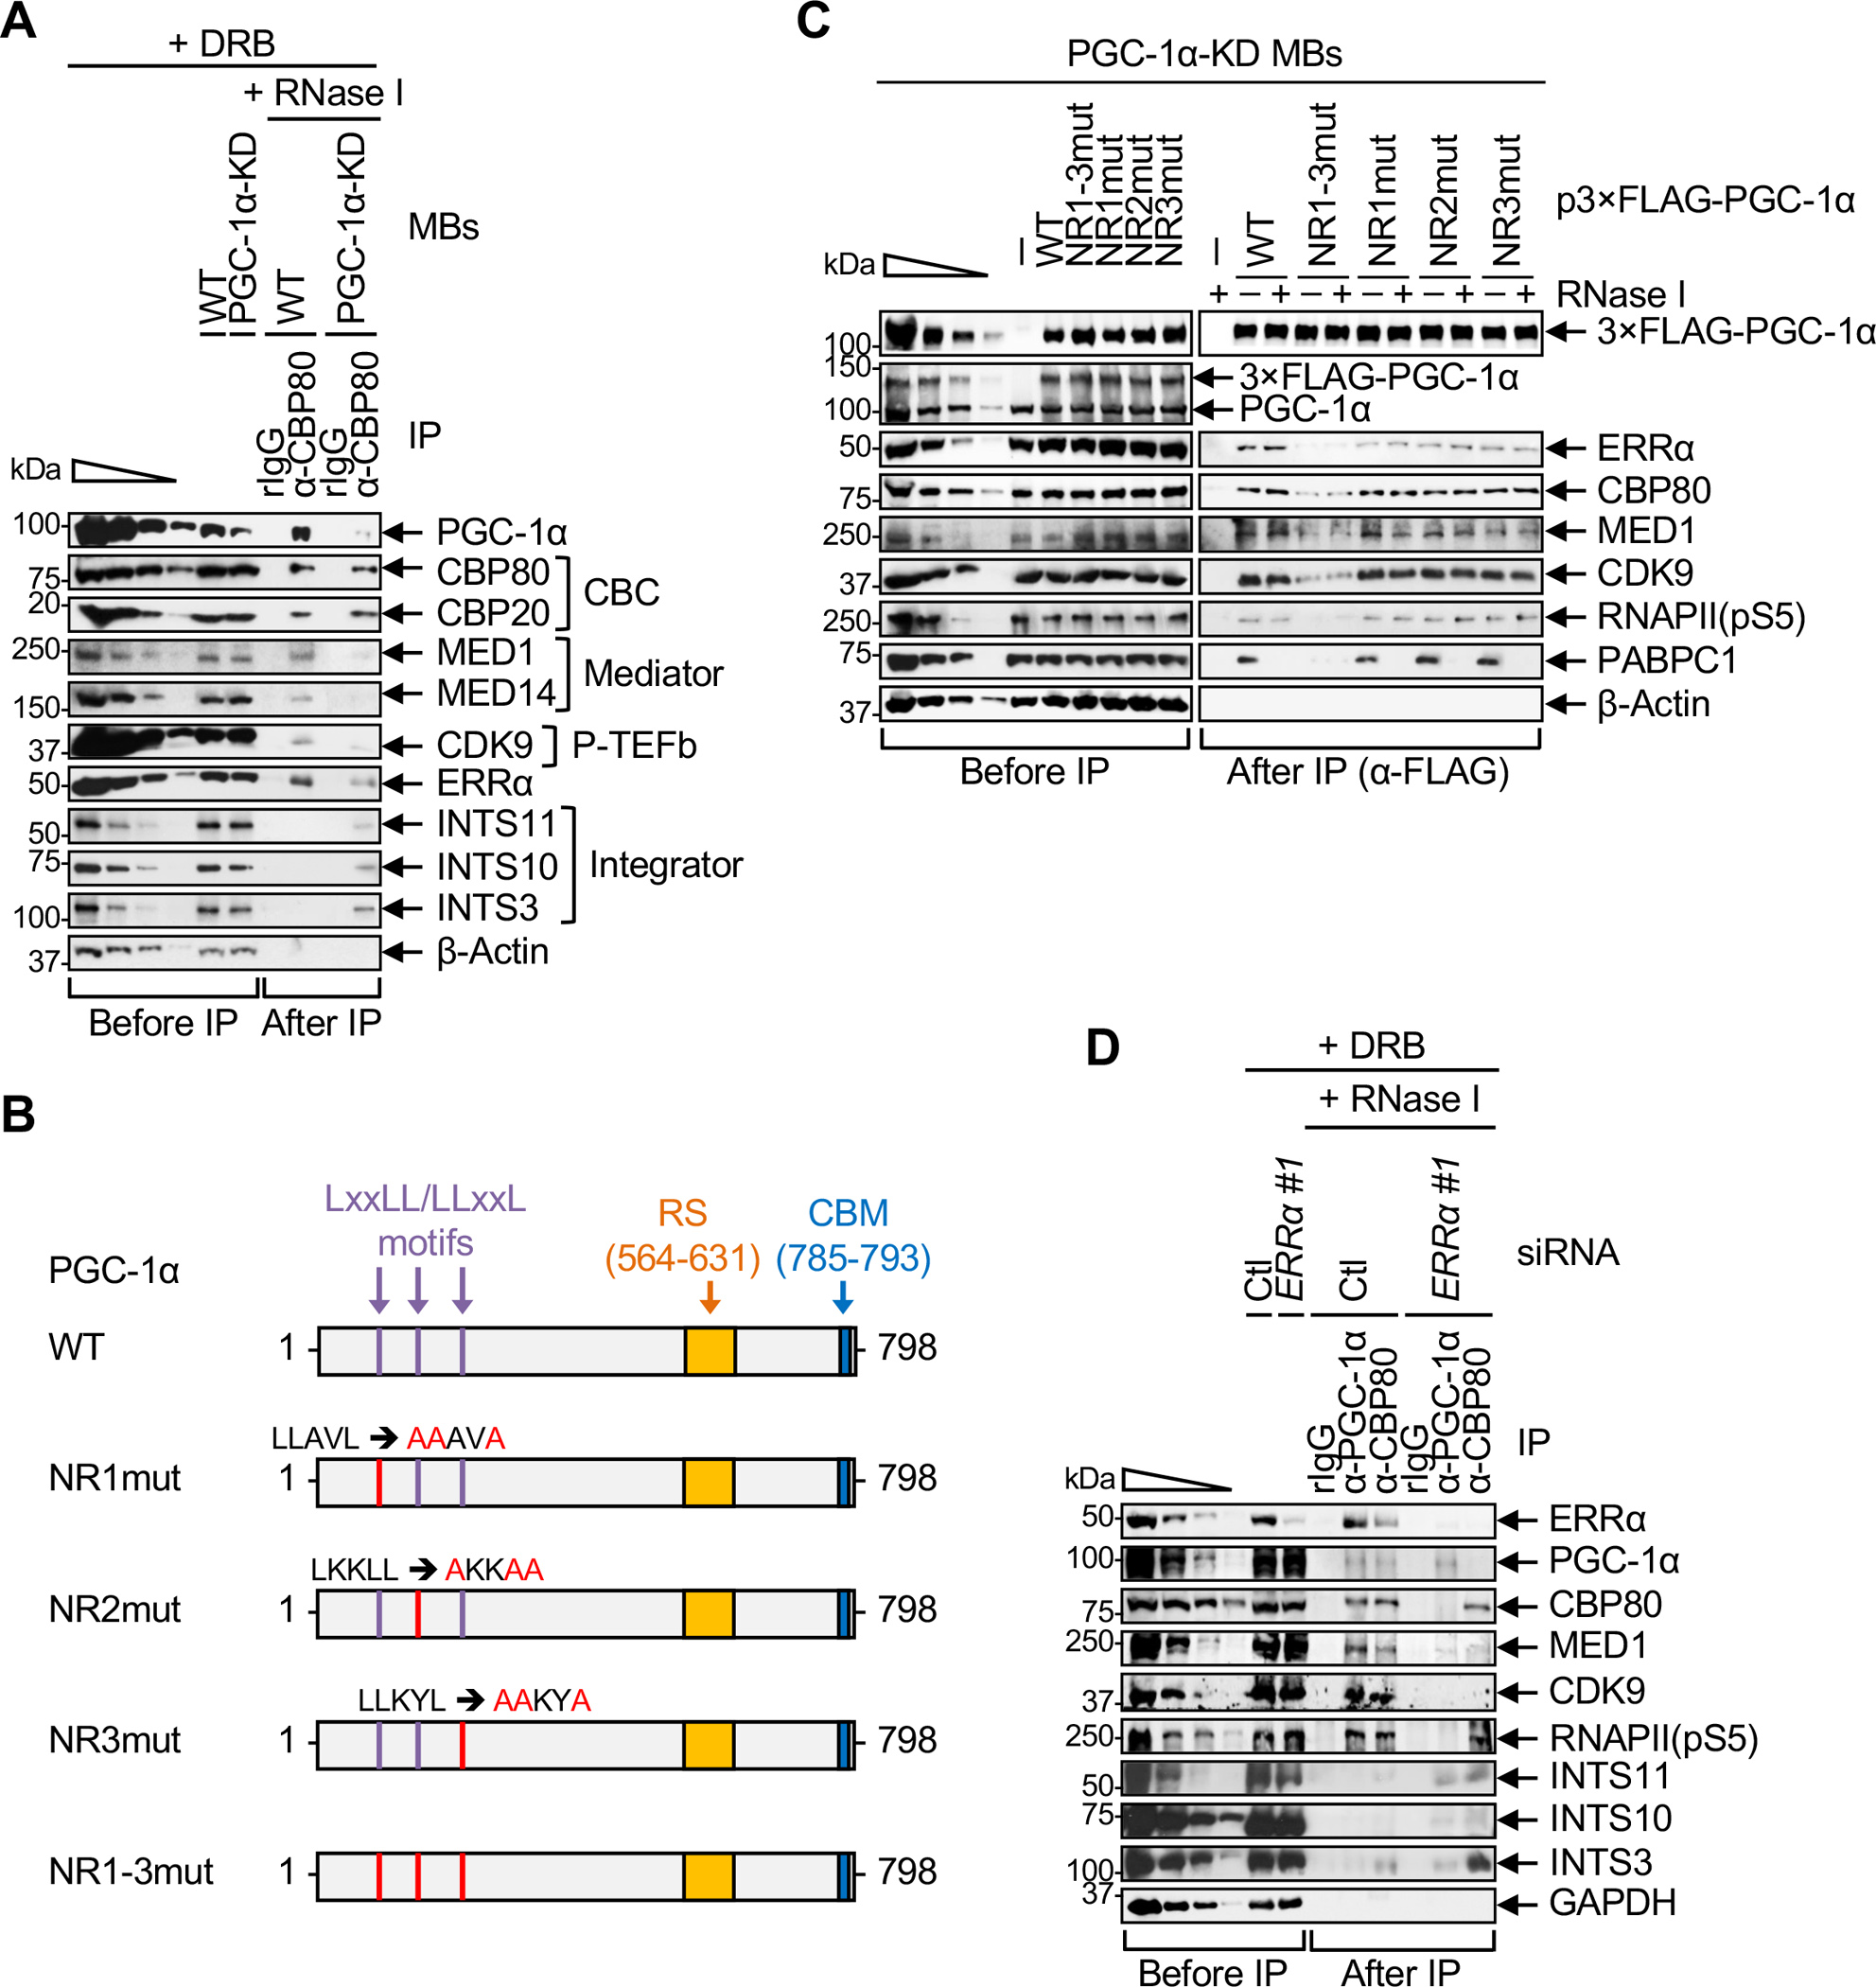
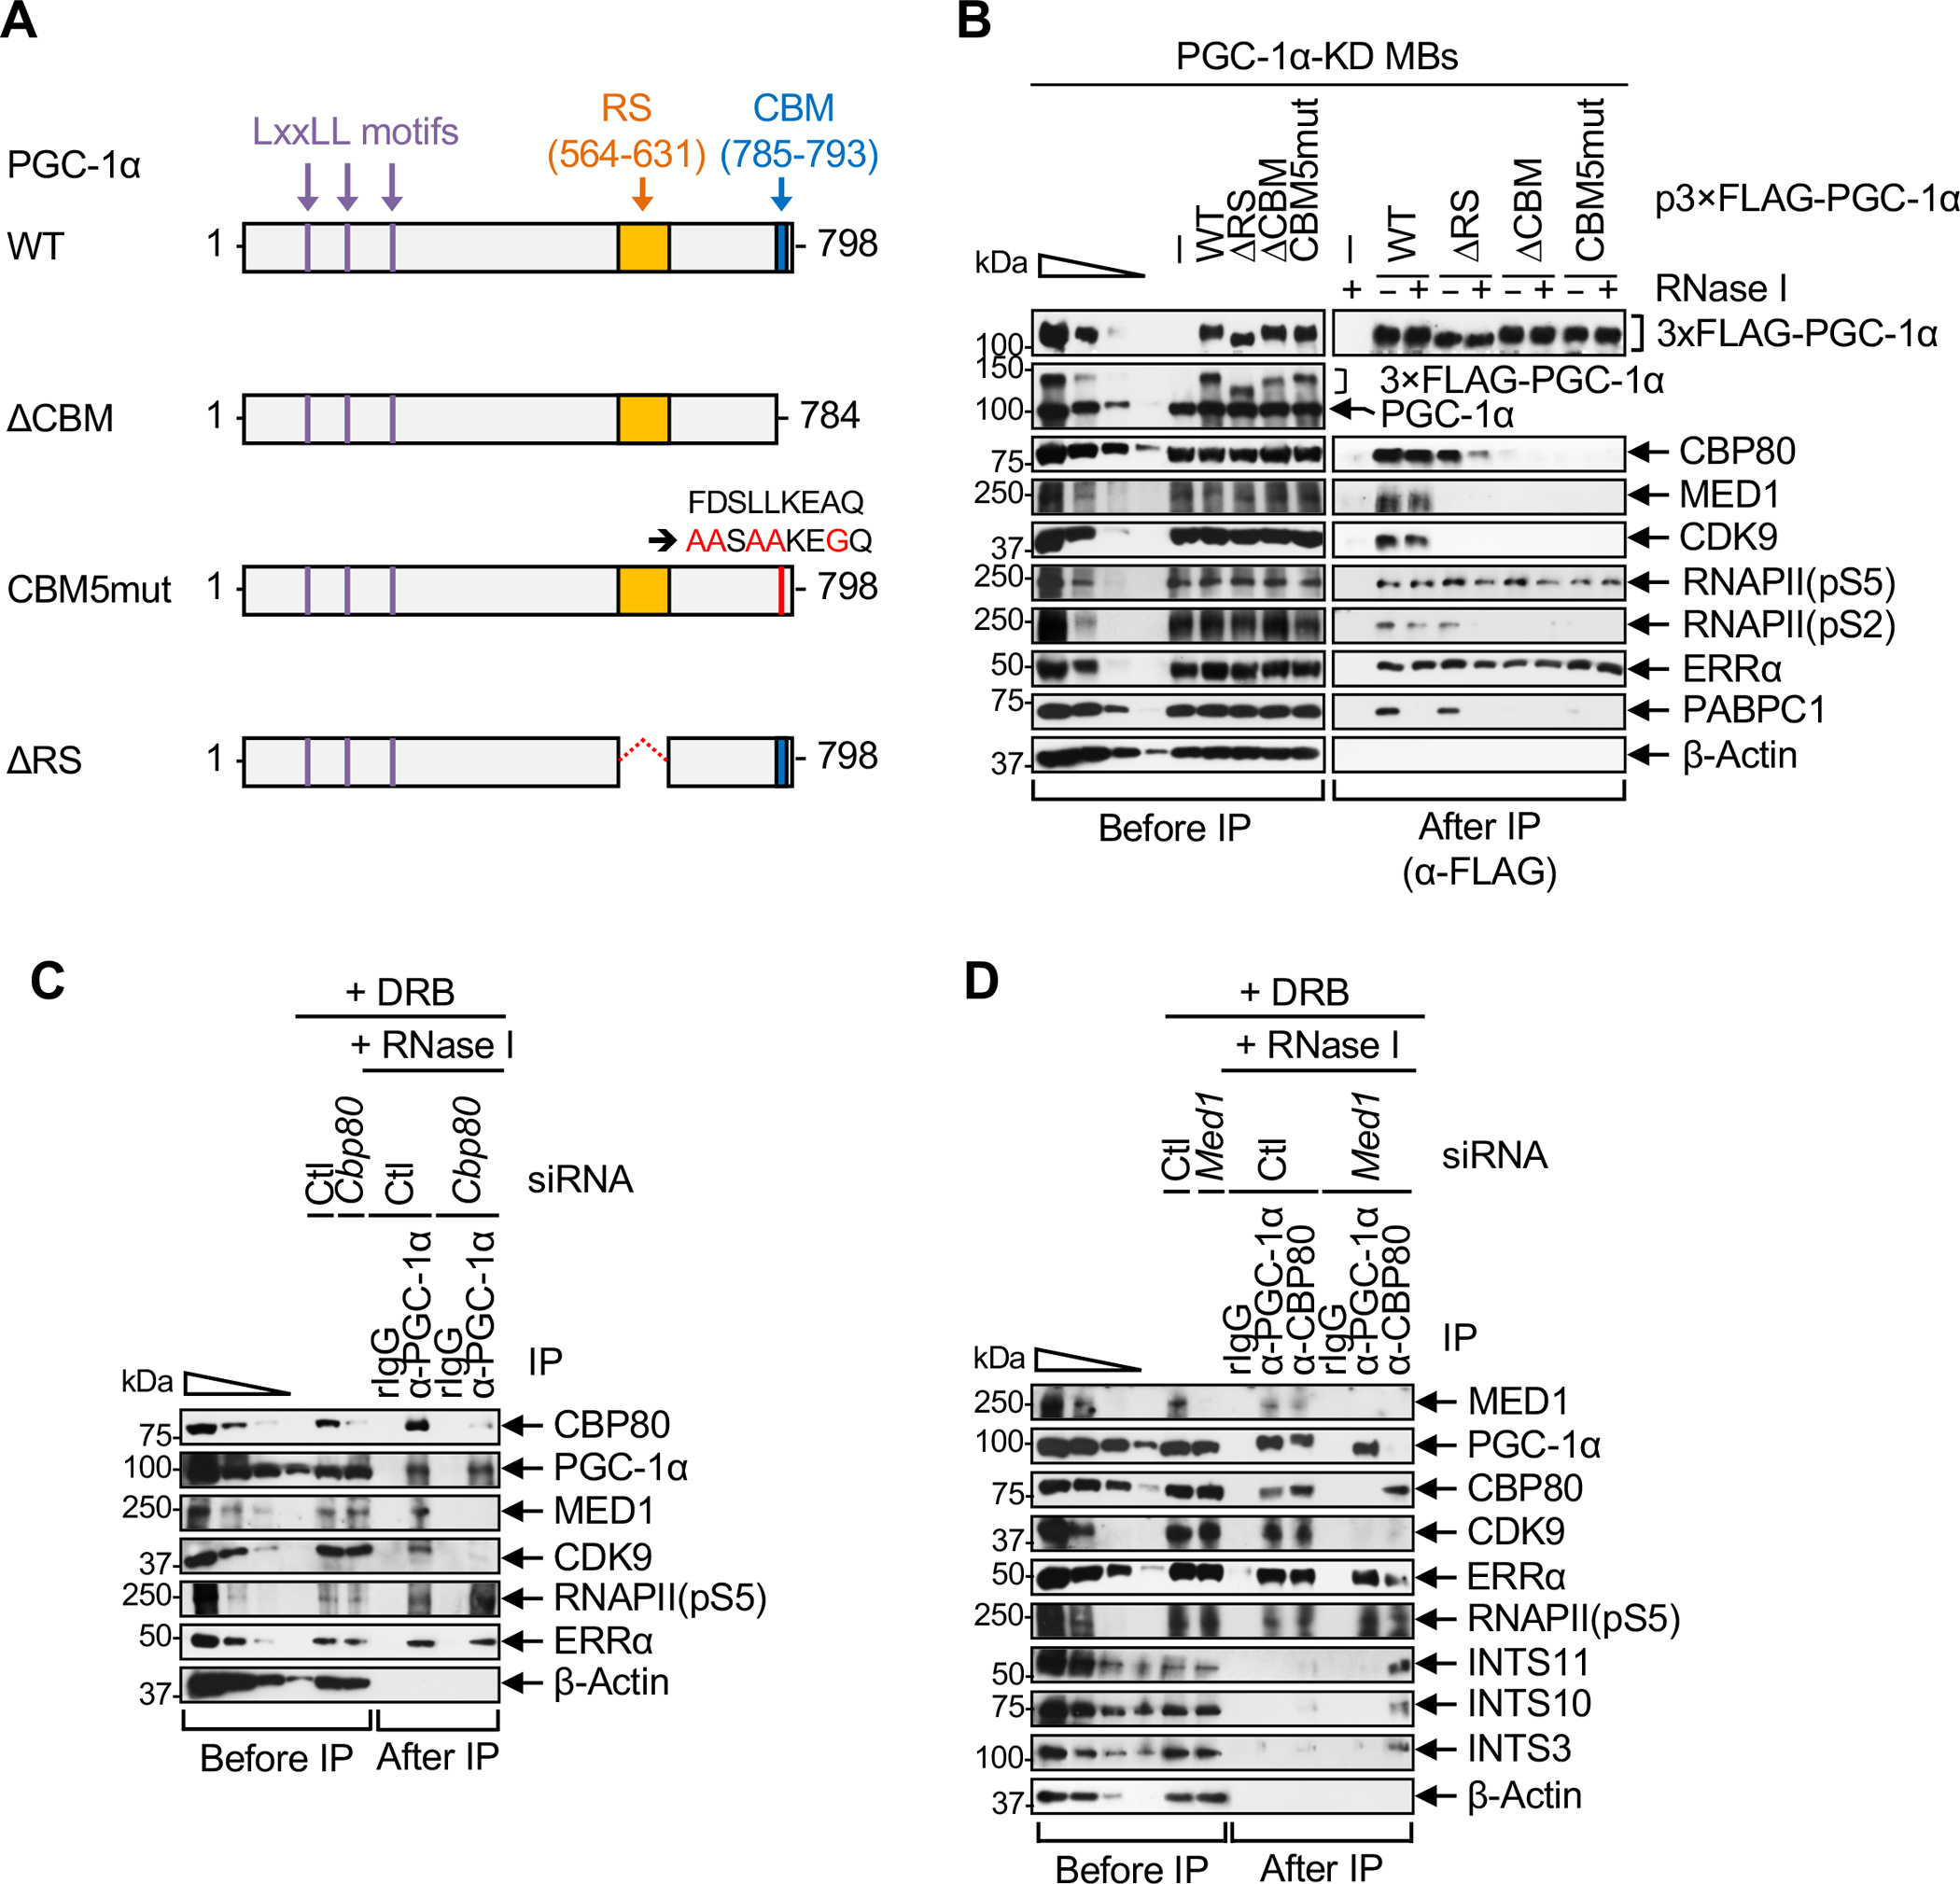
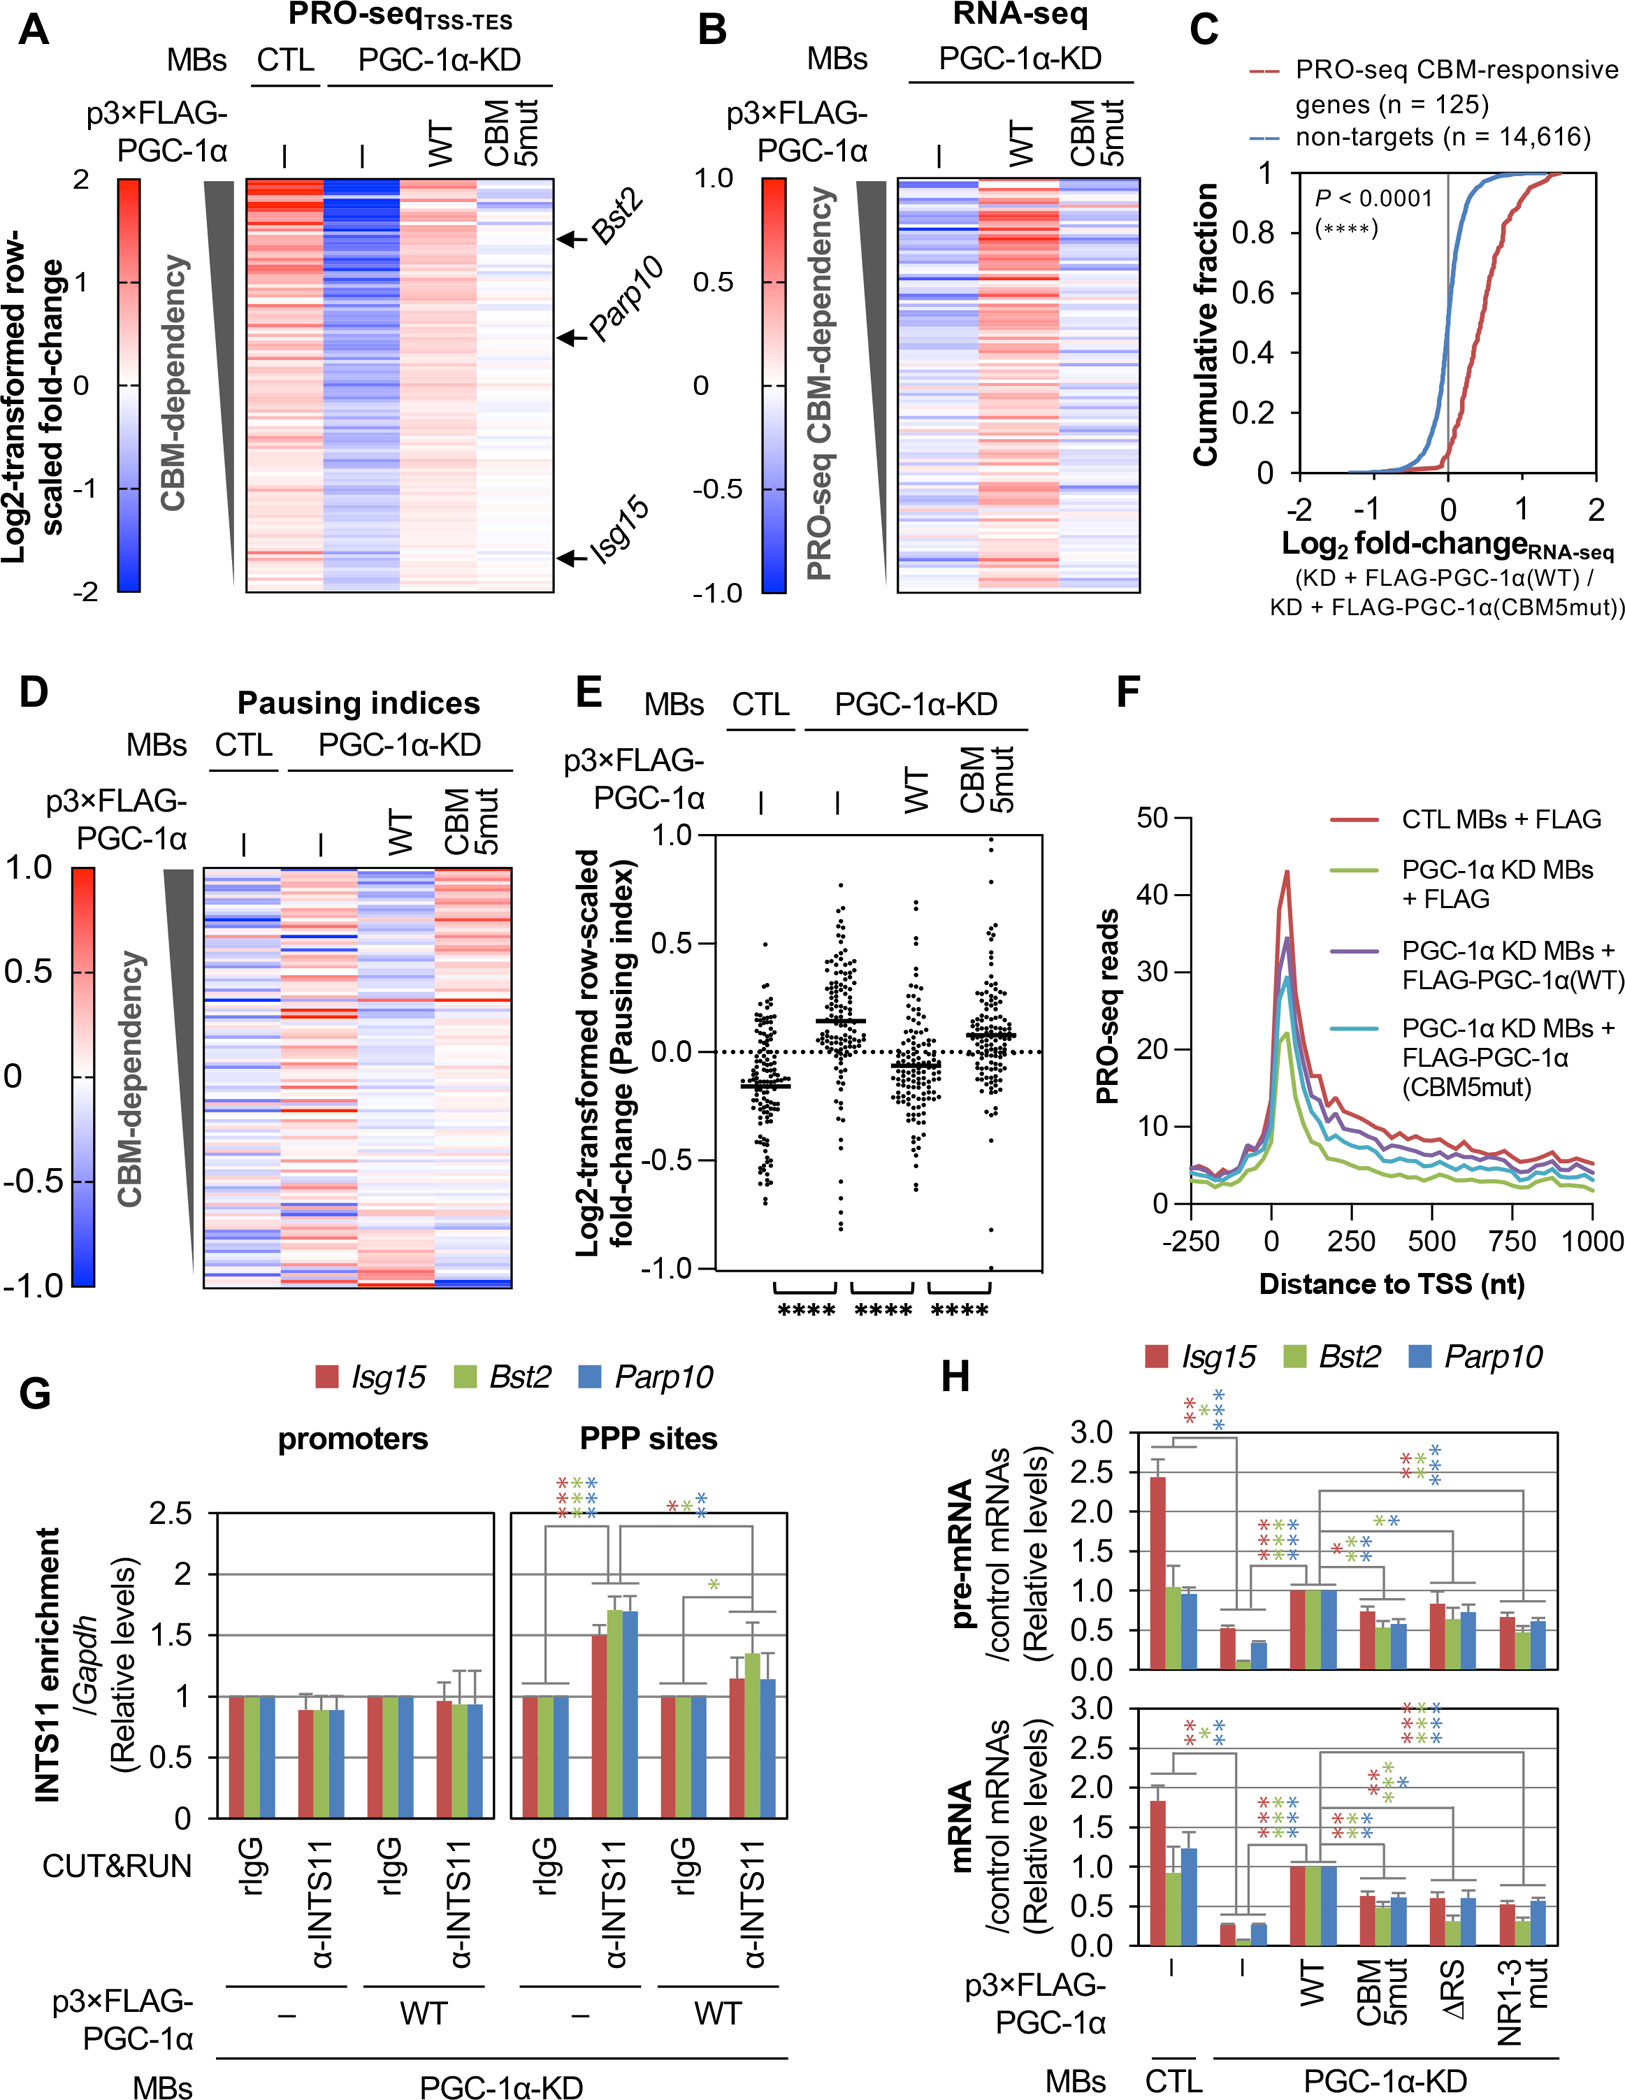
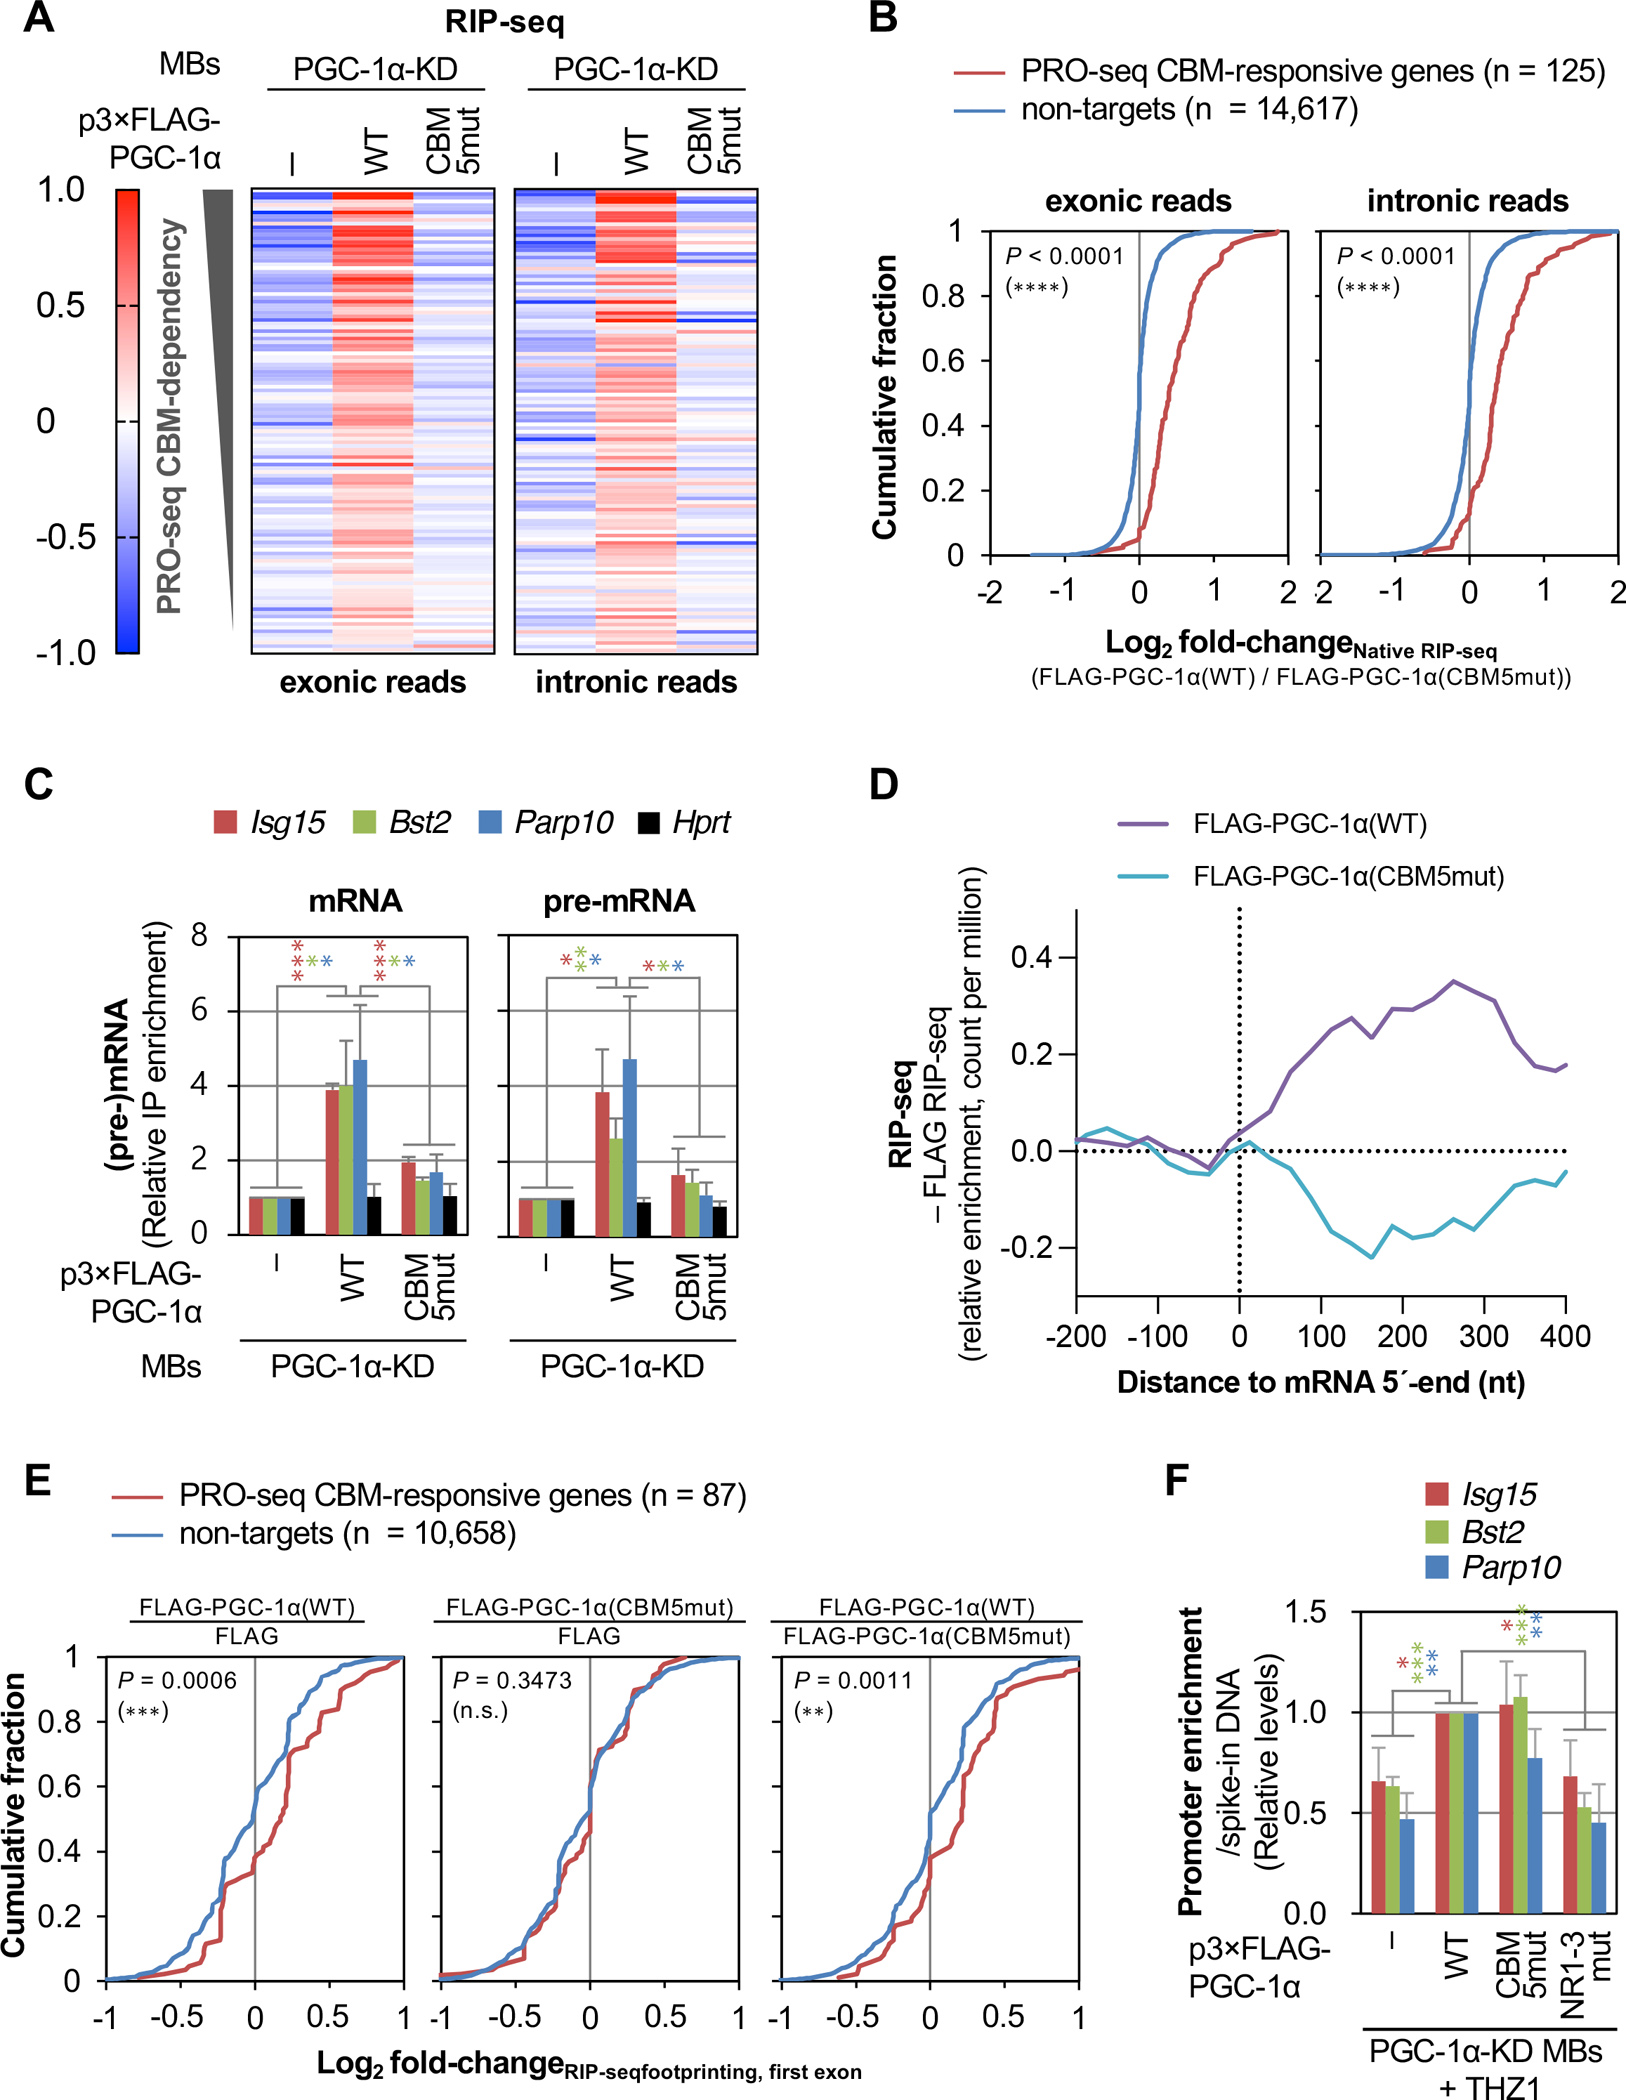
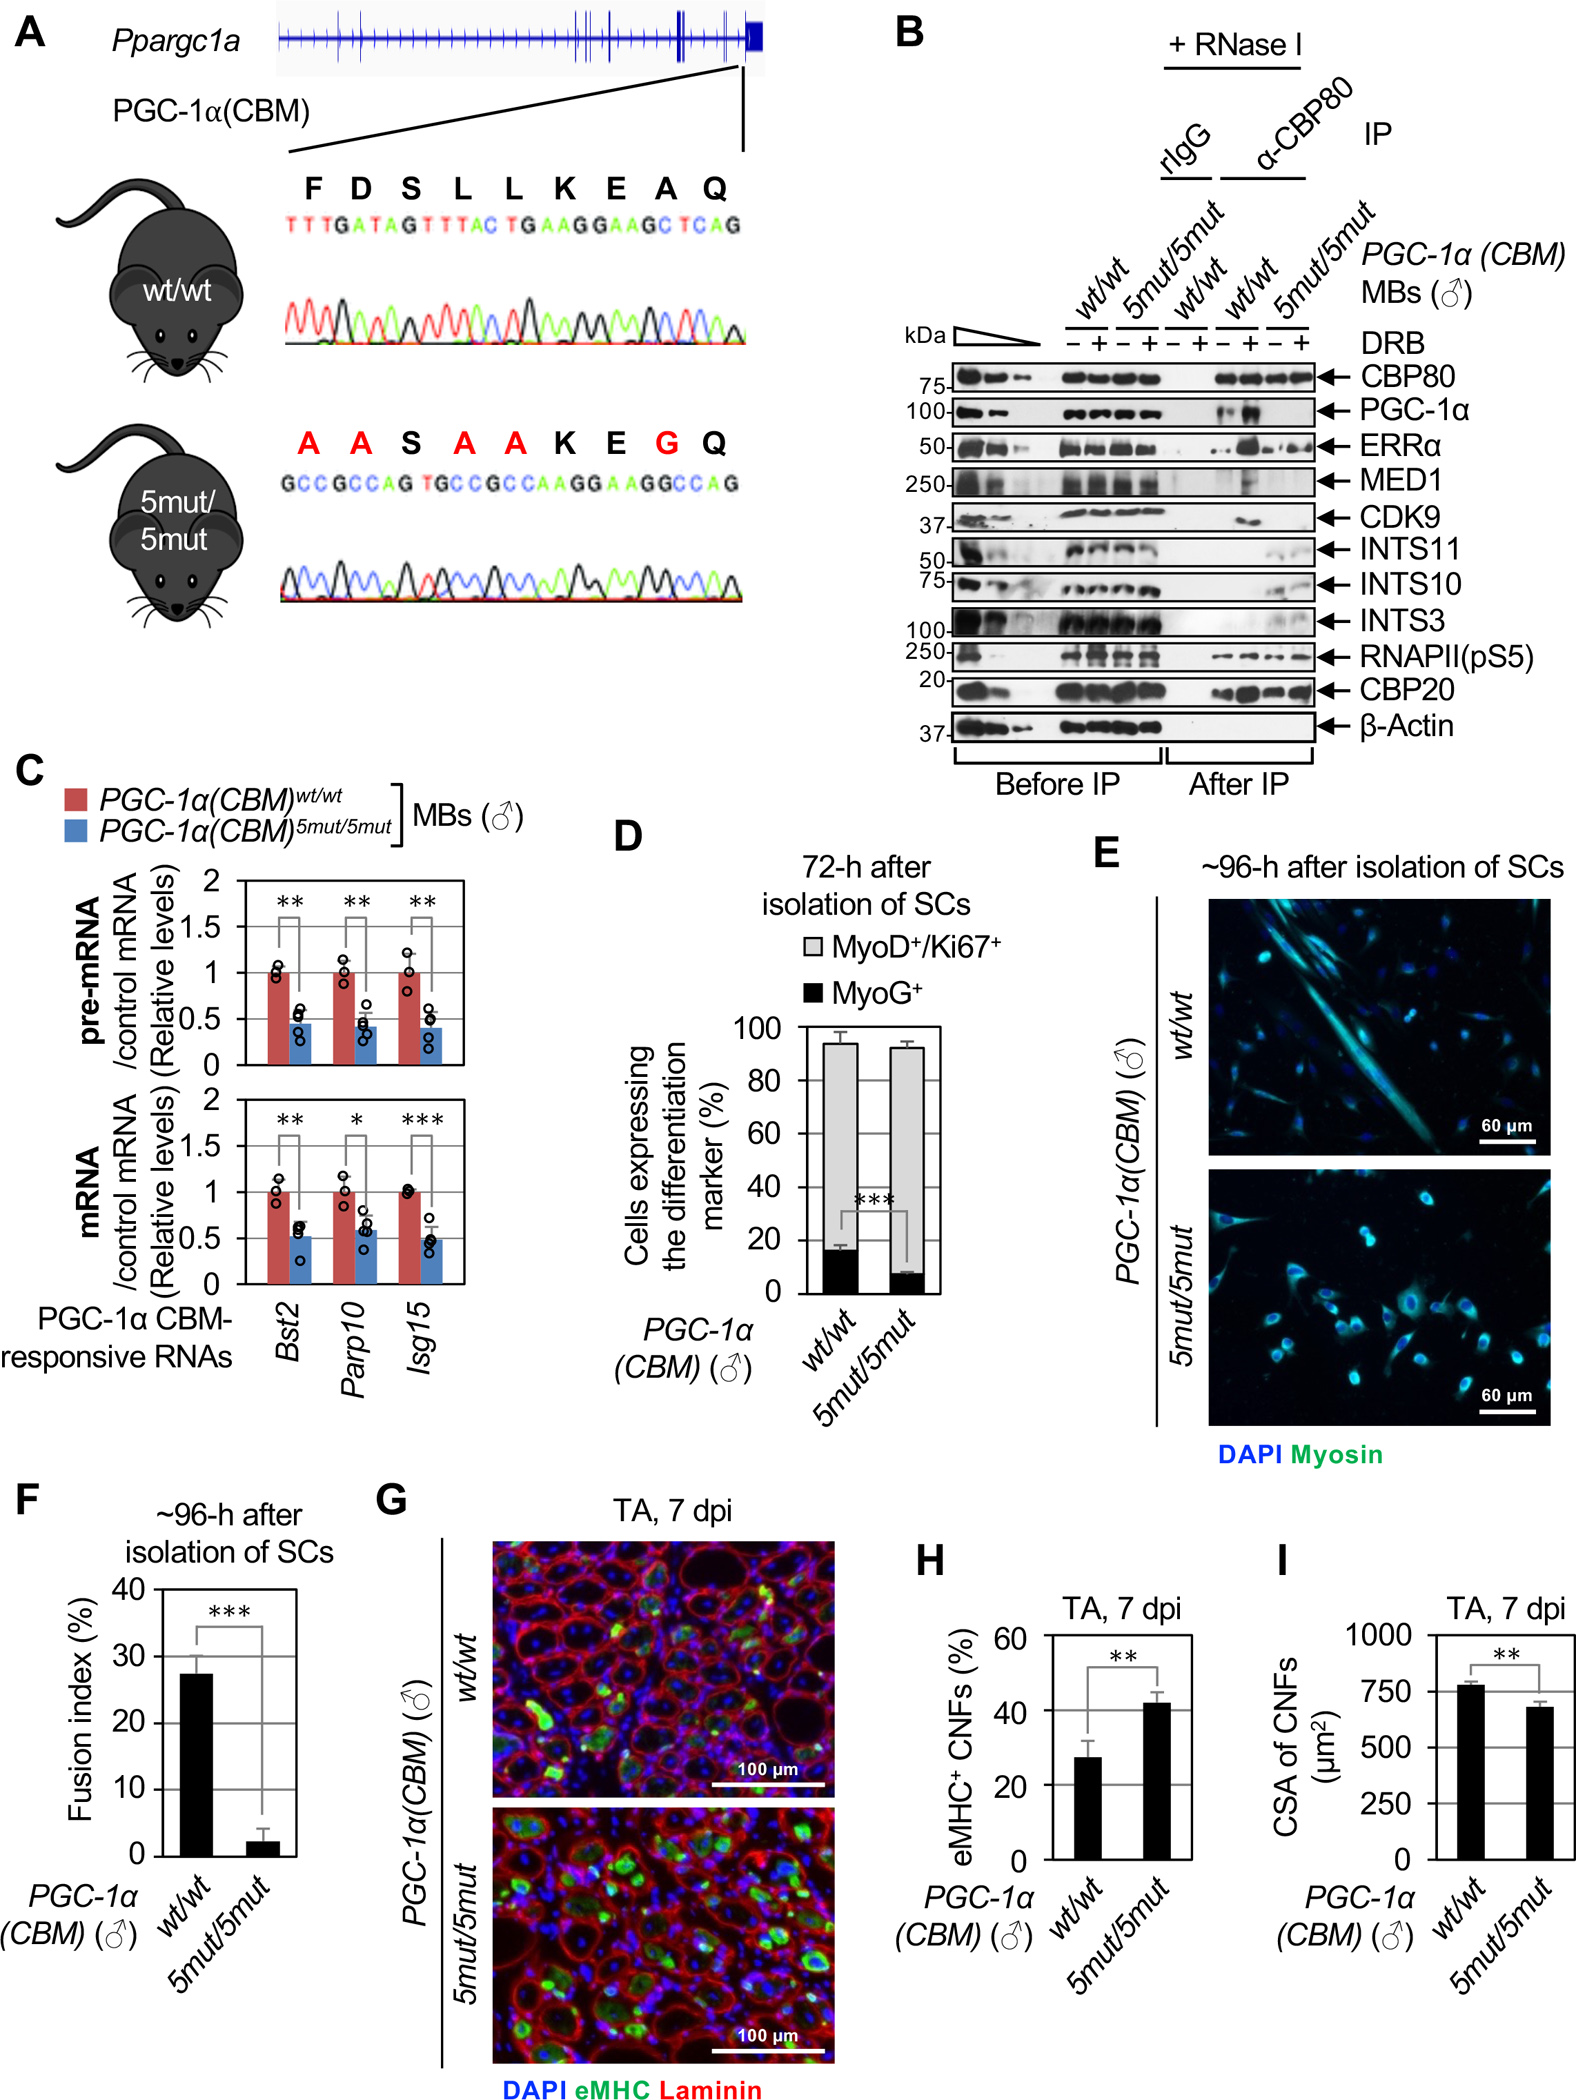
PGC-1α is well established as a metazoan transcriptional coactivator of cellular adaptation in response to stress. However, the mechanisms by which PGC-1α activates gene transcription are incompletely understood. Here, we report that PGC-1α serves as a scaffold protein that physically and functionally connects the DNA-binding protein estrogen-related receptor α (ERRα), cap-binding protein 80 (CBP80), and Mediator to overcome promoter-proximal pausing of RNAPII and transcriptionally activate stress-response genes. We show that PGC-1α promotes pausing release in a two-arm mechanism (1) by recruiting the positive transcription elongation factor b (P-TEFb) and (2) by outcompeting the premature transcription termination complex Integrator. Using mice homozygous for five amino acid changes in the CBP80-binding motif (CBM) of PGC-1α that destroy CBM function, we show that efficient differentiation of primary myoblasts to myofibers and timely skeletal muscle regeneration after injury require PGC-1α binding to CBP80. Our findings reveal how PGC-1α activates stress-response gene transcription in a previously unanticipated pre-mRNA quality-control pathway.

Keywords: CBP80; ERRα; Integrator; Mediator; P-TEFb; PGC-1α; cap-binding complex; gene transcription; interferon signaling; myogenesis; pre-mRNP quality control; promoter-proximal pausing; skeletal muscle regeneration.


Conflict of interest statement

Declaration of interests K.A. is a member of the Advisory Board of Molecular Cell.

Figures

Figure 1.
Figure 1.. PGC-1α complexes with the CBC, Mediator, p-TEFb, ERRα and RNAPII during PPP
(A) Schematic illustrating the effect of culturing cells in the presence of the CDK inhibitors THZ1 or DRB on early steps of gene transcription, i.e. establishment of promoter-proximal pausing (PPP) and release of RNAPII from PPP into transcription elongation, respectively. (B) Western blots (WBs) of lysates of C2C12-MBs that were (+) or were not (−) treated with THZ1 or DRB, before or after IP in the presence of RNase I using anti(α)-PGC-1α or, as a control, rabbit (r)IgG. In this WB and others, β-Actin serves to control for variations in loading and IP specificity, the wedge denotes 3-fold serial dilutions of samples to provide semi-quantitative comparisons, and n = 2–3 biological replicates. For this and all other IPs, cell equivalents in IP lanes relative to before IP lanes are described in Table S1. (C) As in B, but using anti-CBP80 in place of anti-PGC-1α. (D) WBs of lysates of PGC-1α-KD MBs transiently transfected with a plasmid (p) producing 3×FLAG-PGC-1α(WT) (+) or FLAG alone (−) and subsequently treated with DRB, before IP, after a first IP in the presence of RNase I using anti-FLAG, or after a second IP on the eluates of the first IP in the presence of RNase I using anti-CBP80 or, as a control, rIgG. Samples were loaded so that the amounts of CBP80 in the first and second IPs are equivalent. (E) WBs of the solubilized chromatin fraction of PGC-1α-KD MBs transiently expressing 3×FLAG-PGC-1α(WT) or FLAG alone (−), before or after IP in the presence of RNase I using anti-FLAG. eIF4AIII serves to control for variations in loading and to control for IP specificity. (F) WBs of the solubilized chromatin fraction of PGC-1α-KD MBs transiently expressing 3×FLAG-PGC-1α(WT) and treated with DRB, after fractionation in 6–40% sucrose. Fractions were analyzed before or after anti-FLAG IP in the presence of RNase I. See also Figure S1 and Table S1.
Figure 2.
Figure 2.. ERRα mediates functional interactions of PGC-1α with CBP80, Mediator and P-TEFb, and is required for the P4RC to compete against Integrator for CBC binding
(A) WBs of lysates of WT or PGC-1α-KD MBs treated with DRB prior to lysis, before or after IP in the presence of RNase I using anti-CBP80 or, as a control, rIgG. (B) Diagrams of human PGC-1α variants used in C, where red letters denote mutated amino acids in nuclear receptor (NR)-binding LxxLL/LLxxL motifs. RS, arginine- and serine-rich domain; CBM, CBP80-binding motif. Numbers specify amino acids. (C) WBs of lysates of PGC-1α-KD MBs transiently transfected with the specified plasmid before or after IP in the presence (+) or absence (−) of RNase I using anti-FLAG. PABPC1 serves to control for RNase I-sensitive interactions. (D) WBs of lysates of WT MBs that were transiently transfected with Errα or control (Ctl) siRNA and treated with DRB, before or after IP in the presence of RNase I using anti-PGC-1α, anti-CBP80 or, as a control, rIgG. See also Figure S2 and Table S1.
Figure 3.
Figure 3.. PGC-1α binding to CBP80 and Mediator promotes the recruitment of P-TEFb rather than Integrator to the CBC
(A) Diagrams of human PGC-1α, as in Figure 2B but illustrating other PGC-1α variants used in B. (B) WBs, essentially as in Figure 2C. (C) WBs, essentially as in Figure 2D. (D) WBs, essentially as in Figure 2D. See also and Table S1.
Figure 4.
Figure 4.. PGC-1α binding to CBP80, MED1 and ERRα promotes gene transcription by promoting PPP release and preventing early transcription termination
(A) Heatmap representation of raw-scaled full-gene PRO-seq log2-fold changes in the specified MBs, for genes whose levels are significantly (P ≤ 0.01) downregulated at least 1.3-fold after PGC-1α-KD and upregulated at least 1.3-fold after re-expression of FLAG-PGC-1α(WT). Genes are ranked by CBM-dependency, where the least efficient rescue of PRO-seq signal after re-expression of FLAG-PGC-1α(CBM5mut) relative to FLAG-PGC-1α(WT) is at the top. Results are means (n = 2 biological replicates). Genes indicated with arrows are used in subsequent experiments. TSS, transcription start site; TES, transcription end site. (B) As in A, but representing RNA-seq log2-fold changes. Results are means (n = 3 biological replicates). (C) Differential cumulative distribution of the average (n = 3 biological replicates) changes in the abundance of mRNAs measured by RNA-seq in PGC-1α KD MBs transiently expressing FLAG-PGC-1α(WT) relative to FLAG-PGC-1α(CBM5mut). ****, P < 0.0001 comparing PRO-seq PGC-1α-responsive genes (red line) with non-target genes (blue line) using a Kolmogorov-Smirnov test. (D) As in A, but representing raw-scaled log2-fold changes in pausing indices. Results are means (n = 2 biological replicates). (E) Scatter plot representation of gene-scaled log2-fold changes in pausing indices for the specified MBs. Horizontal bars indicate mean values. P-values compare the indicated conditions using a nonparametric Wilcoxon matched-pairs signed rank test. ****, P < 0.0001. (F) Average distribution of PRO-seq signal (n = 2 biological replicates) at and around the TSS of the 125 PGC-1α-responsive genes identified in A. Read counts are summed in non-overlapping 25-nucleotide bins. (G) Histogram representations of CUT&RUN qPCR quantitations of INTS11 binding, in the specified MBs, to the promoter (left) or PPP site (right) of three PGC-1α CBM-activated genes, where values were normalized to binding values obtained for the corresponding locations in the Gapdh gene. Results are means ± S.D. (n = 4 biological replicates). Here and in histograms below, P-values compare the specified MBs using a two-tailed unpaired Student’s t-test. *, P < 0.05; **, P < 0.01; ***, P < 0.001; no asterisks, P ≥ 0.05. Asterisk color corresponds to gene color. (H) Histogram representations of RT-qPCR quantitations of pre-mRNA (top) and mRNA (bottom) from three PGC-1α(CBM)-responsive genes, normalized to the geometric mean of Hprt and Gapdh mRNA levels using lysates of the specified MBs. Results are means ± S.E.M. (n = 3 biological replicates). P-values are as shown in G. See also Figure S3 and Table S2.
Figure 5.
Figure 5.. PGC-1α CBM and NR motifs positively regulate PPP dynamics via binding to CBP80 at the 5´ end of transcripts and to ERRα at gene promoters, respectively
(A) Heatmap representation of raw-scaled RNA-seq log2-fold changes in anti-FLAG IPs (i.e. native RIP-seq) using lysates of the specified MBs and exonic (left) or intronic (right) Illumina reads mapped to transcripts from genes shown in Figure 4A. Results are means (n = 3 biological replicates). (B) Differential cumulative distribution of the average (n = 3 biological replicates) relative enrichment of exonic (left) or intronic (right) Illumina reads in anti-FLAG IPs (native RIP-seq) in lysates of PGC-1α KD MBs transiently expressing FLAG-PGC-1α(WT) relative to FLAG-PGC-1α(CBM5mut). Here and in differential cumulative distributions below, P-values compare PRO-seq CBM-responsive genes (red) or non-target genes (blue) using a Kolmogorov-Smirnov test. (C) Histogram representations of RT-qPCR quantitations of mRNA (left) and pre-mRNA (right) from three PGC-1α(CBM)-responsive genes and control gene Hprt, after anti-FLAG IP relative to before IP using lysates of the specified MBs, where values for PGC-1α-KD MBs expressing FLAG were set to 1. Here and in histograms below, results are means ± S.D. (n = 3 biological replicates), P-values compare the indicated conditions using a two-tailed unpaired Student’s t-test., P < 0.05;, P < 0.01;, P < 0.001; no asterisks, P ≥ 0.05. Asterisk color corresponds to gene color. (D) Average distribution (n = 3 biological replicates) of the relative enrichment of Illumina reads in anti-FLAG IPs using lysates of PGC-1α-KD MBs expressing FLAG-PGC-1α(WT) or FLAG-PGC-1α(CBM5mut), relative to PGC-1α-KD MBs expressing FLAG alone, for the 5ʹ-region of transcripts from genes shown in A. Relative read counts are summed in non-overlapping 25-nucleotide bins. (E) As B, but showing the average (n = 3 biological replicates) relative enrichment of Illumina reads mapping to first exons in RNase I-treated anti-FLAG IPs (i.e. RIP-seq footprinting) from PGC-1α KD cells transiently expressing the specified constructs. Only genes for which first-exon footprints were identified in each IP are included. (F) Histogram representations of CUT&RUN-qPCR quantitations of FLAG or the specified FLAG-PGC-1α variant binding to the promoter of three PGC-1α CBM-activated genes in THZ1-treated PGC-1α KD MBs. Values for PGC-1α KD MBs expressing FLAG-PGC-1α(WT) are set to 1. P-values are as shown in C. See also Figure S4.
Figure 6.
Figure 6.. The P4RC is conserved in mouse skeletal muscle tissues and mediates the differentiation of primary MBs and muscle regeneration
(A) Location of the CRISPR-Cas9-induced point-mutations inserted into both alleles of the mouse Ppargc1a gene to generate the PGC-1α(CBM)5mut/5mut mouse line. Large red letters above the gene sequence indicate changes in CBM residues that were made. (B) WBs of lysates of primary MBs derived from male (♂) PGC-1α(CBM)5mut/5mut or PGC-1α(CBM)wt/wt mice, that were (+) or were not (−) treated with DRB, before or after IP in the presence of RNase I using α-CBP80 or, as a control, rIgG. (C) As Figure 4H, but using lysates of primary MBs derived from male PGC-1α(CBM)5mut/5mut or PGC-1α(CBM)wt/wt mice. Here and for histograms below, results are means ± S.D. (n ≥ 3 biological replicates), P-values compare PGC-1α(CBM)5mut/5mut and PGC-1α(CBM)wt/wt using a two-tailed unpaired Student’s t-test. *, P < 0.05; **, P < 0.01; ***, P < 0.001; no asterisks, P ≥ 0.05. (D) Histogram representations of the percentage of proliferating primary MBs (MyoD+/Ki67+, gray bars) and myocytes (MyoG+, black bars) derived from male PGC-1α(CBM)5mut/5mut or PGC-1α(CBM)wt/wt, 72-hours post-isolation of SCs (n = 4 mice). (E) Representative images of immunofluorescence staining of Myosin (green) and nuclei (DAPI, blue) in SC cultures derived from male PGC-1α(CBM)5mut/5mut or PGC-1α(CBM)wt/wt, 96-hours post-isolation. (F) Histogram representations of the fusion index, i.e. the percentage of cells having ≥ 3 nuclei, of SCs isolated and cultured as in E (n = 4 mice). (G) Representative images of immunofluorescence staining of eMHC (green), Laminin (red), and nuclei (DAPI, blue) in transverse sections of injured tibialis anterior (TA) muscles from male PGC-1α(CBM)5mut/5mut or PGC-1α(CBM)wt/wt mice, isolated 7-days post BaCl2-induced injury (7 dpi). (H) Histogram representations of the percentage of eMHC-positive centrally nucleated fibers (CNFs) in transverse sections of regenerating TA muscles (n =3 mice). (I) As in H but for the cross-sectional area (CSA) of CNFs (n = 3 mice). See also Figures S5,6 and Table S1.

References

    1. Villena JA (2015). New insights into PGC-1 coactivators: redefining their role in the regulation of mitochondrial function and beyond. FEBS J. 282, 647–672. 10.1111/febs.13175. - DOI - PubMed
    1. Chambers JM, and Wingert RA (2020). PGC-1alpha in disease: recent renal insights into a versatile metabolic regulator. Cells 9, 2234. 10.3390/cells9102234. - DOI - PMC - PubMed
    1. Rius-Perez S, Torres-Cuevas I, Millan I, Ortega AL, and Perez S (2020). PGC-1alpha, inflammation, and oxidative stress: an integrative view in metabolism. Oxid. Med. Cell. Longev. 2020, 1452696. 10.1155/2020/1452696. - DOI - PMC - PubMed
    1. Cho H, Rambout X, Gleghorn ML, Nguyen PQT, Phipps CR, Miyoshi K, Myers JR, Kataoka N, Fasan R, and Maquat LE (2018). Transcriptional coactivator PGC-1alpha contains a novel CBP80-binding motif that orchestrates efficient target gene expression. Genes Dev. 32, 555–567. 10.1101/gad.309773.117. - DOI - PMC - PubMed
    1. Lin J, Wu H, Tarr PT, Zhang CY, Wu Z, Boss O, Michael LF, Puigserver P, Isotani E, Olson EN, et al. (2002). Transcriptional co-activator PGC-1 alpha drives the formation of slow-twitch muscle fibres. Nature 418, 797–801. 10.1038/nature00904. - DOI - PubMed

MeSH terms

Substances