. 2023 Jan 20;13(1):1115.
doi: 10.1038/s41598-022-22373-z.

Population differentiated copy number variation between Eurasian wild boar and domesticated pig populations

Affiliations

Population differentiated copy number variation between Eurasian wild boar and domesticated pig populations

Jisung Jang et al. Sci Rep. .

Abstract

Sus scrofa is a globally distributed livestock species that still maintains two different ways of life: wild and domesticated. Herein, we detected copy number variation (CNV) of 328 animals using short read alignment on Sscrofa11.1. We compared CNV among five groups of porcine populations: Asian domesticated (AD), European domesticated (ED), Asian wild (AW), European wild (EW), and Near Eastern wild (NEW). In total, 21,673 genes were identified on 154,872 copy number variation region (CNVR). Differences in gene copy numbers between populations were measured by considering the variance-based value [Formula: see text] and the one-way ANOVA test followed by Scheffe test. As a result, 111 genes were suggested as copy number variable genes. Abnormally gained copy number on EEA1 in all populations was suggested the presence of minor CNV in the reference genome assembly, Sscrofa11.1. Copy number variable genes were related to meat quality, immune response, and reproduction traits. Hierarchical clustering of all individuals and mean pairwise [Formula: see text] in breed level were visualized genetic relationship of 328 individuals and 56 populations separately. Our findings have shown how the complex history of pig evolution appears in genome-wide CNV of various populations with different regions and lifestyles.


Conflict of interest statement

The authors declare no competing interests.

Figures
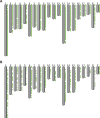
Figure 1
Figure 1
CNVR distribution. Distribution of CNVRs larger than 100 kb (A) and 500 kb (B) were visualized separately. Green rectangles on the right side of chromosomes represents CNVRs.
Figure 2
Figure 2
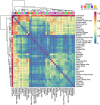
Average of pairwise VST between breeds. Average of pairwise VST of genes on autosomal CNVRs were calculated between all pairs of breeds which included more than 1 sample. Clustering were performed only on the mean pairwise VST.
Figure 3
Figure 3
Manhattan plot of VST. VST of genes on autosomal CNVRs were visualized as Manhattan plots. The center point of genes was used as an x-coordinate value. Genes with significantly different pairwise VST in upper 0.1% were marked by their names. Name of hypothetical, putative, predicted or uncharacterized genes and pseudo-genes were excluded due to lack of space. The upper 1% percentile VST, 0.157, and upper 0.1% percentile, 0. 409, were shown as blue and red lines, respectively.
Figure 4
Figure 4
Average copy number of 5 groups in EEA1. Average copy number around EEA1 coding region. X-axis indicated genomic region and y-axis indicated average copy number in each group. EEA1 located from 90,131,707 to 90,257,014 in chromosome 5 and the average copy number of every 1000bp regions from 90,131,001 to 90,258,000 were visualized as a line graph. The two peak regions were 90,227,001–90,240,000 and 90,244,001–90250000.

References

    1. Groenen MA, Archibald AL, Uenishi H, Tuggle CK, Takeuchi Y, Rothschild MF, Rogel-Gaillard C, Park C, Milan D, Megens H-J. Analyses of pig genomes provide insight into porcine demography and evolution. Nature. 2012;491(7424):393–398. doi: 10.1038/nature11622. - DOI - PMC - PubMed
    1. Frantz LA, Schraiber JG, Madsen O, Megens H-J, Bosse M, Paudel Y, Semiadi G, Meijaard E, Li N, Crooijmans RP. Genome sequencing reveals fine scale diversification and reticulation history during speciation in Sus. Genome Biol. 2013;14(9):1–12. doi: 10.1186/gb-2013-14-9-r107. - DOI - PMC - PubMed
    1. Fang M, Larson G, Soares Ribeiro H, Li N, Andersson L. Contrasting mode of evolution at a coat color locus in wild and domestic pigs. PLoS Genet. 2009;5(1):e1000341. doi: 10.1371/journal.pgen.1000341. - DOI - PMC - PubMed
    1. Frantz LA, Haile J, Lin AT, Scheu A, Geörg C, Benecke N, Alexander M, Linderholm A, Mullin VE, Daly KG. Ancient pigs reveal a near-complete genomic turnover following their introduction to Europe. Proc. Natl. Acad. Sci. 2019;116(35):17231–17238. doi: 10.1073/pnas.1901169116. - DOI - PMC - PubMed
    1. Larson G, Liu R, Zhao X, Yuan J, Fuller D, Barton L, Dobney K, Fan Q, Gu Z, Liu X-H. Patterns of East Asian pig domestication, migration, and turnover revealed by modern and ancient DNA. Proc. Natl. Acad. Sci. 2010;107(17):7686–7691. doi: 10.1073/pnas.0912264107. - DOI - PMC - PubMed

Publication types