. 2023 Jan 20;3(1):10.
doi: 10.1038/s43856-023-00237-5.

Serum biomarker-based early detection of pancreatic ductal adenocarcinomas with ensemble learning

Affiliations

Serum biomarker-based early detection of pancreatic ductal adenocarcinomas with ensemble learning

Nuno R Nené et al. Commun Med (Lond). .

Abstract

Background: Earlier detection of pancreatic ductal adenocarcinoma (PDAC) is key to improving patient outcomes, as it is mostly detected at advanced stages which are associated with poor survival. Developing non-invasive blood tests for early detection would be an important breakthrough.

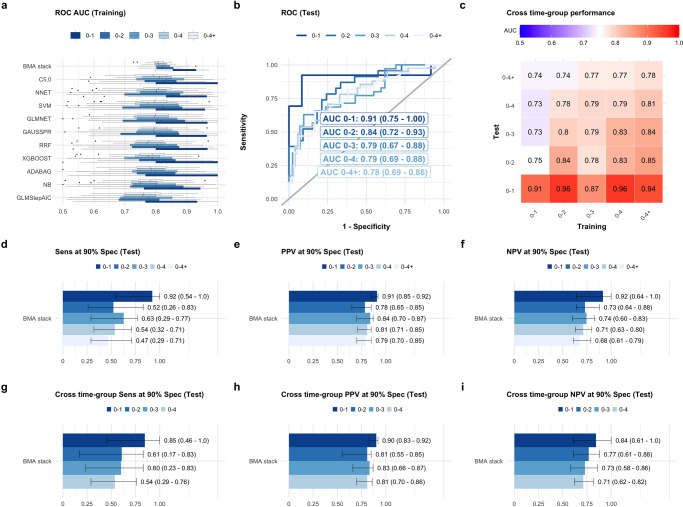
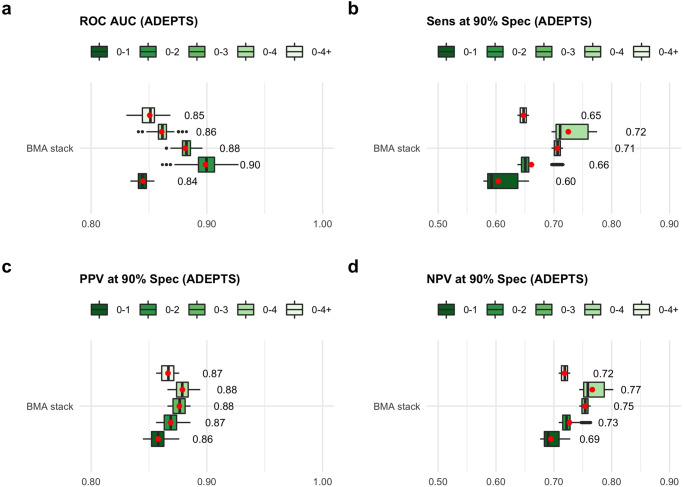
Methods: The primary objective of the work presented here is to use a dataset that is prospectively collected, to quantify a set of cancer-associated proteins and construct multi-marker models with the capacity to predict PDAC years before diagnosis. The data used is part of a nested case-control study within the UK Collaborative Trial of Ovarian Cancer Screening and is comprised of 218 samples, collected from a total of 143 post-menopausal women who were diagnosed with pancreatic cancer within 70 months after sample collection, and 249 matched non-cancer controls. We develop a stacked ensemble modelling technique to achieve robustness in predictions and, therefore, improve performance in newly collected datasets.

Results: Here we show that with ensemble learning we can predict PDAC status with an AUC of 0.91 (95% CI 0.75-1.0), sensitivity of 92% (95% CI 0.54-1.0) at 90% specificity, up to 1 year prior to diagnosis, and at an AUC of 0.85 (95% CI 0.74-0.93) up to 2 years prior to diagnosis (sensitivity of 61%, 95% CI 0.17-0.83, at 90% specificity).

Conclusions: The ensemble modelling strategy explored here outperforms considerably biomarker combinations cited in the literature. Further developments in the selection of classifiers balancing performance and heterogeneity should further enhance the predictive capacity of the method.

Plain language summary

Pancreatic cancers are most frequently detected at an advanced stage. This limits treatment options and contributes to the dismal survival rates currently recorded. The development of new tests that could improve detection of early-stage disease is fundamental to improve outcomes. Here, we use advanced data analysis techniques to devise an early detection test for pancreatic cancer. We use data on markers in the blood from people enrolled on a screening trial. Our test correctly identifies as positive for pancreatic cancer 91% of the time up to 1 year prior to diagnosis, and 78% of the time up to 2 years prior to diagnosis. These results surpass previously reported tests and should encourage further evaluation of the test in different populations, to see whether it should be adopted in the clinic.


Conflict of interest statement

The authors declare the following competing interests: U.M. reports stock ownership in Abcodia UK between 2011 and 2021; U.M. has received grants from the Medical Research Council (MRC), Cancer Research UK, the National Institute for Health Research (NIHR), the India Alliance, NIHR Biomedical Research Centre at University College London Hospital, and The Eve Appeal; U.M. currently has research collaborations with iLOF, RNA Guardian and Micronoma, with funding paid to UCL; U.M. holds patent number EP10178345.4 for Breast Cancer Diagnostics; A.G. currently has research collaborations with Micronoma and iLoF, with the research funding awarded to UCL. No other potential conflicts of interest were disclosed by any of the authors.

Figures

Fig. 1
Fig. 1. Ensemble model performance per joined/combined time-group.
a Distribution of receiver operating curve (ROC) area under the curve (AUC) across training folds for each of the base-learners and the Bayesian Model Averaging (BMA) stack meta-learner (Joined Time Group 2 Layer (JTG2L) model, see ‘Methods’ section on statistical analysis). See also Supplementary Figs. 24, 25 to 28 for alternative stacking methods. b ROC curves in the test set for the BMA stack per joined time-group. AUC 95% Confidence Intervals (CI) were determined by stratified bootstrapping. c Cross-time group performance of the BMA stack developed in the training set and evaluated in specific time-groups in the test set. 95% CI for AUCs are not shown but the predictions were all significant. d Sensitivity (Sens), e Positive predictive value (PPV) and f Negative predictive value (NPV) at 90% Specificity (Spec) corresponding to b. gi Cross time-group performances for the ensemble trained in 0-4+ samples (last column in c). See also Supplementary Fig. 29 for other stacking methods. For the Matthew correlation coefficients corresponding to di, see Supplementary Fig. 30. In a, b, di, shades of blue from dark to light correspond to results obtained in 0-1, 0-2, 0-3, 0-4 and 0-4+ years to diagnosis samples, respectively. The number of independent training samples was n = 107 (0-1), n = 180 (0-2), n = 252 (0-3), n = 309 (0-4) and n = 363 (0-4+). The number of independent test set samples was n = 26 (0-1), n = 60 (0-2), n = 82 (0-3), n = 98 (0-4) and n = 114 (0-4+). See Supplementary Table 12 for further details on case and control samples. See ‘Statistical analysis’ in Methods for further details and Supplementary Data 1–3.
Fig. 2
Fig. 2. Feature importance across pancreatic ductal adenocarcinoma base-learner signatures.
a Odds-ratios (represented proportionally by the size of the circles) and P-values for the ranking procedure according to a logistic regression model using Firth’s bias reduction method in the training set. b Feature importance across all base learners and joined time-groups. All the features (biomarkers and clinical covariates) presented in this figure were selected when training/optimizing the ensemble approach with 0-4+ samples. The importance plotted for the remaining joined time-groups is the importance of each feature in their respective models. See also Supplementary Fig. 33 for the full plots and additionally Supplementary Fig. 34 for models developed with single time-groups. In a and b shades of blue from dark to light correspond to results obtained in 0-1, 0-2, 0-3, 0-4 and 0-4+ years to diagnosis samples, respectively. See ‘Statistical analysis’ in Methods for further details and Supplementary Data 4, 5. OCP oral contraceptive pill use. HRT hormone replacement therapy.
Fig. 3
Fig. 3. Enrichment analysis.
g:Profiler terms for the set of features selected by the optimal classifier trained in 0-4+ samples. a Kyoto Encyclopaedia of Genes and Genomes (KEGG) pathways. c Reactome Pathway Database (REAC). e WikiPathways (WP). g Gene ontology terms biological process (GO: BP). The respective adjusted p-values associated with each enrichment term or pathway are plotted in (b), (d), (f) and (h). See also Fig. 2. See ‘Statistical analysis’ in Methods for further details and Supplementary Data 6.
Fig. 4
Fig. 4. Performance in an external validation set.
a Receiver operating curve (ROC) area under the curve (AUC) in the Accelerated Diagnosis of neuro Endocrine and Pancreatic TumourS (ADEPTS) external validation set for the Joined Time Group 2 Layer (JTG2L) Bayesian Model Averaging (BMA) stack models developed and selected in the UKCTOCS training set in the respective joined time-group samples (see Fig. 1), coloured in shades of green from dark to light for 0-1, 0-2, 0-3, 0-4, 0-4+ YTD samples. b Sensitivity (Sens), c Positive predictive value (PPV) and d Negative predictive value (NPV) at 90% specificity (Spec) (see also Supplementary Fig. 39 for the corresponding Matthew’s correlation coefficient value). The performances correspond to 1000 datasets whose difference from the original ADEPTS subset selected for this study is the random allocation of the missing features hormone replacement therapy (HRT) and oral contraceptive pill use (OCP) to female participants. The red dots and respective numbers correspond to estimates of the mean performance in ADEPTS (by bootstrapping with the boot R package (version 1.3–25)) for the respective model developed in UKCTOCS time-grouped samples. The number of independent ADEPTS samples was n = 34. See ‘Study design’ and ‘Statistical analysis’ sections in Methods for further details, and Supplementary Data 7.

References

    1. Bengtsson A, Andersson R, Ansari D. The actual 5-year survivors of pancreatic ductal adenocarcinoma based on real-world data. Sci. Rep. 2020;10:16425. doi: 10.1038/s41598-020-73525-y. - DOI - PMC - PubMed
    1. Gemenetzis G, et al. Survival in locally advanced pancreatic cancer after neoadjuvant therapy and surgical resection. Ann. Surg. 2019;270:340–347. doi: 10.1097/SLA.0000000000002753. - DOI - PMC - PubMed
    1. Pereira SP, et al. Early detection of pancreatic cancer. Lancet Gastroenterol. Hepatol. 2020;5:698–710. doi: 10.1016/S2468-1253(19)30416-9. - DOI - PMC - PubMed
    1. Hidalgo M. Pancreatic cancer. N. Engl. J. Med. 2010;362:1605–1617. doi: 10.1056/NEJMra0901557. - DOI - PubMed
    1. Ghaneh P, et al. The impact of positive resection margins on survival and recurrence following resection and adjuvant chemotherapy for pancreatic ductal adenocarcinoma. Ann. Surg. 2019;269:520–529. doi: 10.1097/SLA.0000000000002557. - DOI - PubMed