. 2023 Jan 21;42(1):26.
doi: 10.1186/s13046-022-02587-9.

Long-term exposure to house dust mites accelerates lung cancer development in mice

Affiliations

Long-term exposure to house dust mites accelerates lung cancer development in mice

Dongjie Wang et al. J Exp Clin Cancer Res. .

Abstract

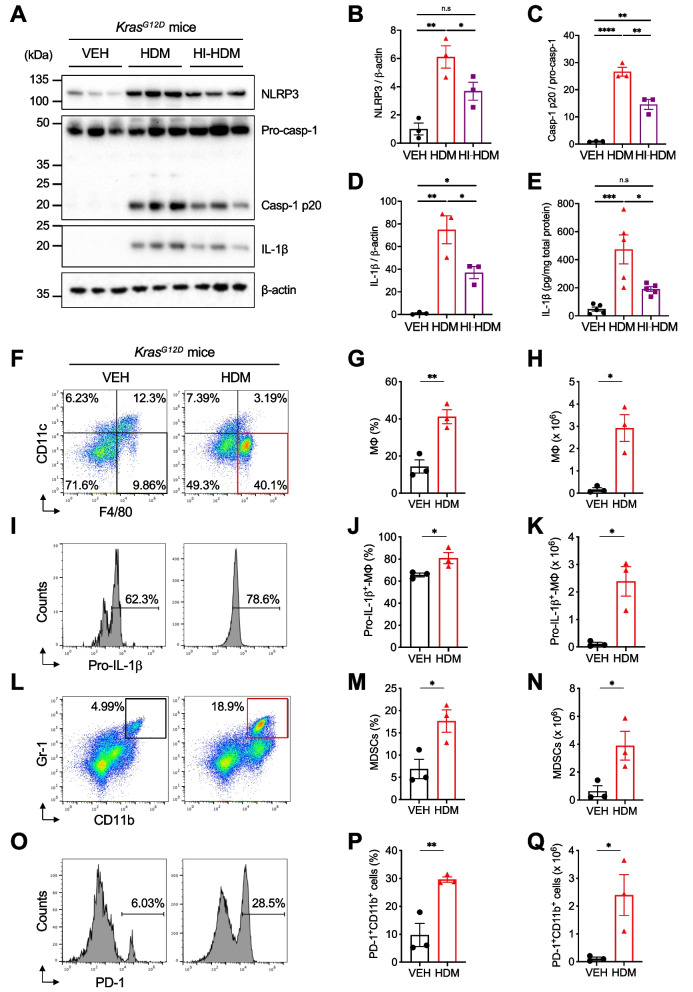
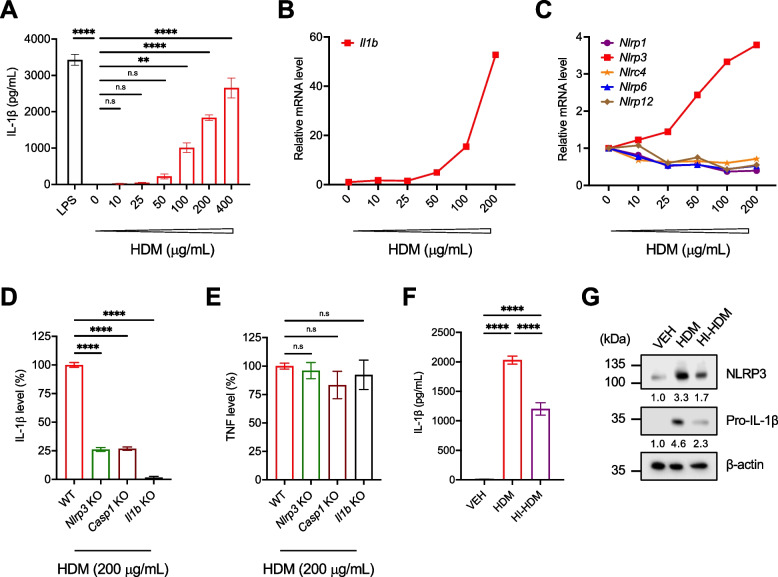
Background: Individuals with certain chronic inflammatory lung diseases have a higher risk of developing lung cancer (LC). However, the underlying mechanisms remain largely unknown. Here, we hypothesized that chronic exposure to house dust mites (HDM), a common indoor aeroallergen associated with the development of asthma, accelerates LC development through the induction of chronic lung inflammation (CLI). METHODS: The effects of HDM and heat-inactivated HDM (HI-HDM) extracts were evaluated in two preclinical mouse models of LC (a chemically-induced model using the carcinogen urethane and a genetically-driven model with oncogenic KrasG12D activation in lung epithelial cells) and on murine macrophages in vitro. Pharmacological blockade or genetic deletion of the Nod-like receptor family pyrin domain-containing protein 3 (NLRP3) inflammasome, caspase-1, interleukin-1β (IL-1β), and C-C motif chemokine ligand 2 (CCL2) or treatment with an inhaled corticosteroid (ICS) was used to uncover the pro-tumorigenic effect of HDM. RESULTS: Chronic intranasal (i.n) instillation of HDM accelerated LC development in the two mouse models. Mechanistically, HDM caused a particular subtype of CLI, in which the NLRP3/IL-1β signaling pathway is chronically activated in macrophages, and made the lung microenvironment conducive to tumor development. The tumor-promoting effect of HDM was significantly decreased by heat treatment of the HDM extract and was inhibited by NLRP3, IL-1β, and CCL2 neutralization, or ICS treatment.

Conclusions: Collectively, these data indicate that long-term exposure to HDM can accelerate lung tumorigenesis in susceptible hosts (e.g., mice and potentially humans exposed to lung carcinogens or genetically predisposed to develop LC).

Keywords: CCL2; Chronic inflammation; House dust mites; IL-1β; Kras; Lung cancer; Macrophages; NLRP3; Tumor microenvironment; Urethane.


Conflict of interest statement

HMH has received speaking fees from Novartis, consulting fees from Novartis, SOBI, Regeneron, and IFM, and research funds from Glaxo Wellcome, Vertex, Burroughs Wellcome, and Jecure. ML, ZA, HS, and DS are employees, shareholders, and/or option holders at Cell IDx. The other authors declare that they have no competing interests.

Figures

Fig. 1
Fig. 1
Effect of chronic exposure to HDM in a urethane-induced LC model. A WT C57BL/6 mice were treated i.n with HDM (n = 8), HI-HDM (n = 10), or with the vehicle (VEH, n = 9) and i.p with urethane as indicated in this schematic overview of the study design. B Representative photos of 4 lung lobes (dorsal view). Scale bars, 0.25 cm. C Lung weight normalized to mouse body weight (BW). D Representative pictures of H&E-stained lung sections. One lobe per mouse is shown. Arrowheads indicate tumors. Scale bars, 1 mm. E Two selected ROIs on the H&E-stained lung section of the mouse treated with urethane and HDM shown in D. ROI#1 shows dense perivascular and peribronchial mononuclear inflammatory infiltrates (left). ROI#2 shows a papillary AD (right). Scale bars, 0.1 mm. F Representative photo of an H&E-stained lung section showing an AC of the papillary type found in one lung lobe of a mouse treated with urethane and HDM. The right panel shows the boxed region (ROI#3) at higher magnification with enlarged nuclei, prominent nucleoli, and scattered mitotic figures (indicated by arrows). Scale bars, 1 mm (left panel) and 0.1 mm (ROI#3). G IHC staining for TTF-1 of the AC shown in F. The H&E and TTF-1 staining were performed on non-serial sections of the same lung lobe. The right panel shows the boxed region (ROI#4) with strong nuclear staining for TTF-1 in tumor cells at higher magnification. Scale bars, 1 mm (left panel) and 0.2 mm (ROI#4). H Tumor multiplicity (i.e., the number of lung lesions per mouse). I Tumor area (i.e., the sum of lesion surface areas per mouse). The parameters in H and I were calculated on H&E-stained sections as shown in D. J The relative mRNA levels of several genes involved in cell proliferation were analyzed by qPCR in lung homogenates and were normalized to Krt19 gene expression. The mean expression level of each gene in the VEH group was used as a reference and was assigned the value of 1. Data are representative of one (G), two (J), or three (AF, H, and I) independent experiments and are presented as mean ± SEM. Statistical significance was assessed by one-way (C, H, and I) or two-way (J) ANOVA with post hoc Bonferroni’s test. n.s: non-significant, * P < 0.05, ** P < 0.01, *** P < 0.001, **** P < 0.0001
Fig. 2
Fig. 2
Effect of chronic exposure to HDM in a KrasG12D-driven LC model. A. KrasG12D mice were treated i.n with VEH (n = 7), HDM (n = 8), or HI-HDM (n = 7) as indicated in this schematic overview of the study design. B Relative body weight of the mice. C Survival curves of mice treated as in A with VEH (n = 13), HDM (n = 19), or HI-HDM (n = 8). Death events occurring within the first 4 weeks after the beginning of the treatments were excluded. Values are expressed as a percentage of survival. D BALF total cell counts. E Representative pictures of H&E-stained lung sections. The lower panels are the same images as the above panels after tumor area quantification using QuPath software. QuPath-pseudocolored areas are represented as tumors (blue), normal lung cells and infiltrating immune cells (green), heart tissue and eosinophilic cells (orange), blood vessels and areas of hemorrhage (red). Scale bars, 2 mm. F Two selected ROIs on the H&E-stained lung section of the HDM-treated mouse shown in E. ROI#1 (left panel) demonstrates dense perivascular and peribronchial immune infiltrates with high numbers of macrophages (inset). ROI#2 (right panel) shows an AC with papillary morphology invading the bronchial lumen (inset) and stromal desmoplasia (indicated by asterisks). Scale bars, 2 mm (whole lungs), 0.2 mm (ROI#1 and 2), and 0.1 mm (ROI#1 and 2 insets). G Tumor multiplicity calculated on H&E-stained sections as shown in E upper panels. H Tumor area calculated on QuPath-pseudocolored images as shown in E lower panels. I Tumors on H&E-stained sections as shown in E upper panels were classified into three grades (Grade 1, AAH and EH; Grade 2, AD; Grade 3, AC) and each grade was expressed as a percentage of the total. Data are presented as mean ± SEM. Statistical significance was assessed by one-way (D, G, and H) or two-way (B and I) ANOVA with post hoc Bonferroni’s test, or log-rank Mantel-Cox test (C). n.s: non-significant, * P < 0.05, ** P < 0.01, *** P < 0.001, **** P < 0.0001
Fig. 3
Fig. 3
HDM activates the NLRP3/IL-1β signaling pathway in the lungs and generates a pro-tumor lung microenvironment. A Lung tissues of KrasG12D mice treated i.n with VEH, HDM, or HI-HDM, as shown in Fig. 2A, were homogenized for western blot analysis of NLRP3, caspase-1, IL-1β, and β-actin expression (n = 3 mice/group). Blots are representative of at least 3 independent experiments. B Densitometric measurements of NLRP3, C) caspase-1 p20 and D) IL-1β, relative to β-actin (B and D) or pro-caspase-1 (C) in the blots shown in A. E) ELISA analysis of IL-1β production in lung tissue homogenates as in A (n = 5 mice/group). F-I The lungs of KrasG12D mice treated i.n with VEH or HDM as shown in Supplemental Fig. 2A were harvested on day 61 (24 h after the last i.n treatment) and single-cell suspensions were prepared for flow cytometry analyses. F Representative dot plots of macrophages (MΦ) identified as CD11b+CD11cF4/80+ cells (see Supplemental Fig. 3A for gating strategy). G Frequencies and H) absolute numbers of MΦ as shown in F. I) Representative histograms showing intracellular levels of pro-IL-1β in MΦ gated as in F. J) Frequencies and K) absolute numbers of pro-IL-1β+-MΦ as shown in I. L Representative dot plots of MDSCs (identified as CD11b+Gr-1hi cells). M Frequencies and N) absolute numbers of MDSCs as shown in L. O Representative histograms showing PD-1 expression levels on CD11b+ cells (see Supplemental Fig. 3A for gating strategy). P Frequencies and Q) absolute numbers of PD-1+CD11b.+ cells as shown in O. Data are representative of one (FQ) or two (AE) independent experiments and are presented as mean ± SEM. Statistical significance was assessed by one-way ANOVA with post hoc Bonferroni’s test (A-E) or two-tailed Student’s t-test (F-Q). n.s: non-significant, * P < 0.05, ** P < 0.01, *** P < 0.001
Fig. 4
Fig. 4
HDM activates the NLRP3 inflammasome and induces IL-1β production by murine macrophages. A BMDMs isolated from WT mice were treated for 24 h with LPS (100 ng/mL) or with the indicated concentrations of HDM. ATP (5 mM) was added to each well during the last hour of culture as shown in Supplemental Fig. 4A. The supernatants were collected and IL-1β production was analyzed by ELISA. Results are representative of n = 2 independent experiments performed in triplicate. B RAW 264.7 macrophages were stimulated for 6 h with indicated concentrations of HDM and the relative mRNA level of Il1b or C) different NLRs was measured by qPCR and normalized to Gapdh gene expression. The relative mRNA level in the HDM’s 0 μg/mL condition was used as a reference and assigned to 1. Results are representative of n = 2 independent experiments performed in simplicate. D BMDMs isolated from WT (n = 6), Nlrp3 (n = 2), Casp1 (n = 3), or Il1b (n = 3) KO mice were stimulated with HDM (200 μg/mL) and ATP (5 mM) as shown in Supplemental Fig. 4A, and the levels of IL-1β or E) TNF in the supernatants were analyzed by ELISA. The cytokine level in the WT control group was used as a reference and assigned to 100%. Results are the pooled data from n = 3 independent experiments performed in triplicate. F WT BMDMs were stimulated with VEH (PBS), HDM, or HI-HDM (both at 200 μg/mL) and ATP (5 mM) as described in Supplemental Fig. 4A, and the levels of IL-1β in the supernatants were analyzed by ELISA. Results are representative of n = 2 independent experiments performed in triplicate. G The cells stimulated in F were recovered and total cell lysates were prepared for western blot analysis of NLRP3 and pro-IL-1β expression. Densitometric measurements of NLRP3 and pro-IL-1β relative to β-actin are indicated below each blot. Results are representative of n = 2 independent experiments performed in simplicate. Data are presented as mean ± SEM. Statistical significance was assessed by one-way ANOVA with post hoc Bonferroni’s test. n.s: non-significant, * P < 0.05, ** P < 0.01, *** P < 0.001, **** P < 0.0001
Fig. 5
Fig. 5
Neutralization of IL-1β or CCL2 inhibits the lung tumor-promoting effect of HDM. A Representative pictures of H&E-stained lung sections of Kras.G12D mice treated i.n with VEH or HDM and i.p with a neutralizing anti-IL-1β, anti-CCL2, or with the isotype control (ctrl) Ab as shown in Supplemental Fig. 5A. VEH + ctrl Ab (n = 6), HDM + ctrl Ab (n = 8), VEH + IL-1β Ab (n = 7), and HDM + IL-1β Ab (n = 8), VEH + CCL2 Ab (n = 7), and HDM + CCL2 Ab (n = 9). Scale bars, 2 mm. B Tumor multiplicity calculated on H&E-stained sections as shown in A. C Tumors on H&E-stained sections as shown in A were classified into three grades (Grade 1, AAH and EH; Grade 2, AD; Grade 3, AC) and each grade was expressed as a percentage of the total. D Representative pictures of H&E-stained lung sections of WT and Il1b KO mice treated i.n with VEH or HDM and with urethane as shown in Fig. 1A. WT + VEH (n = 7), WT + HDM (n = 8), Il1b KO + VEH (n = 8), and Il1b KO + HDM (n = 10). Four lobes per mouse are shown. Arrowheads indicate tumors. Scale bars, 1 mm. E Two selected ROIs on the H&E-stained lung sections shown in D. ROI#1 shows an AC with enlarged nuclei, prominent nucleoli, and scattered mitotic figures (inset) found in one lung lobe of a WT mouse treated with urethane and HDM. ROI#2 shows an AD of the papillary type with uniform nuclei (inset) found in one lung lobe of an Il1b KO mouse treated with urethane and HDM. Scale bars, 0.1 mm (ROI#1 and 2) and 50 μm (ROI#1 and 2 insets). F Tumor multiplicity and G) Tumor area calculated on H&E-stained sections as shown in D. Data are representative of one experiment conducted in two to five independent cohorts of mice pooled together (AC ctrl and CCL2 Abs, and DG) or conducted twice independently (AC IL-1β Ab) and are presented as mean ± SEM. Statistical significance was assessed by one- (B, F, and G) or two-way (C) ANOVA with post hoc Bonferroni’s test. n.s: non-significant, * P < 0.05, ** P < 0.01, *** P < 0.001, **** P < 0.0001
Fig. 6
Fig. 6
HDM makes the lung TME conducive to tumor growth and IL-1β neutralization abrogates this effect. A Representative pictures of H&E-stained lung sections from KrasG12D mice (n = 3 mice/group) treated i.n with VEH or HDM as shown in Fig. 2A, or i.n with HDM and i.p with a neutralizing anti-IL-1β Ab as shown in Supplemental Fig. 6A. The whole lung of one representative mouse from each experimental group is shown. B mIF staining of lung sections of the mice shown in A. Overlay (top) and single colors (bottom). DAPI nuclear staining (blue), F4/80 (magenta), Ki-67 (cyan) and PanCK (yellow). C Selected ROI#1 (left) and ROI#2 (right) from the H&E-stained lung section of the HDM-treated mouse in A showing inflammatory cell infiltrates and a representative grade 3 lesion, respectively. D IHC staining for TTF-1 of the same ROI#1 and ROI#2 as in C. E Corresponding mIF images showing high F4/80 immunoreactivity in parenchymal lung tissue (left, ROI#1), and high Ki-67 immunoreactivity in tumor cells as well as peritumoral F4/80+ cell infiltration (right, ROI#2). Overlay (top) and single colors (bottom). F Quantification of F4/80+ cells in whole lungs. G Quantification of Ki-67.+ cells in tumor areas. Scale bars, 2 mm (whole lungs), 0.4 mm (ROI#1), and 0.8 mm (ROI#2). Data are representative of one (A, C, and D) or two (B, EG) independent experiments and are presented as mean ± SEM. Statistical significance was assessed by one-way ANOVA with post hoc Bonferroni’s test. n.s: non-significant, * P < 0.05, ** P < 0.01
Fig. 7
Fig. 7
Budesonide inhibits the LC-promoting effect of HDM in KrasG12D mice and HDM-induced IL-1β production by macrophages. AKras.G12D mice were treated i.n with VEH and dimethyl sulfoxide (DMSO), HDM and DMSO, or HDM and budesonide (Bud) as indicated in this schematic overview of the study design. VEH + DMSO (n = 4), HDM + DMSO (n = 7), and HDM + Bud (n = 11). B Representative pictures of H&E-stained lung sections of mice treated as in A. Scale bars, 2 mm. C Tumor multiplicity calculated on H&E-stained sections as shown in B. D BMDMs were isolated from WT mice as shown in Supplemental Fig. 4A and were treated for 6 h with VEH (PBS) or HDM (200 μg/mL) and DMSO (0.01%) or with HDM (200 μg/mL) and budesonide (Bud, 1 nM), and the relative mRNA level of Il1b was measured by qPCR and normalized to Gapdh gene expression. The relative mRNA level in the VEH condition was used as a reference and assigned to 1. E WT BMDMs were treated as in D but for 24 h. ATP (5 mM) was added to each well for the last hour of culture and total cell lysates were prepared for western blot analysis of NLRP3 and pro-IL-1β expression. Densitometric measurements of NLRP3 and pro-IL-1β relative to β-actin are indicated below each blot. F The culture supernatants from the cells stimulated in E were recovered and the levels of IL-1β were analyzed by ELISA. Data are representative of two (AC) or three (DF) independent experiments and are expressed as mean ± SEM. Statistical significance was assessed by one-way ANOVA with post hoc Bonferroni’s test. n.s: non-significant, * P < 0.05, ** P < 0.01, **** P < 0.0001

References

    1. Bray F, Ferlay J, Soerjomataram I, Siegel RL, Torre LA, Jemal A. Global cancer statistics 2018: GLOBOCAN estimates of incidence and mortality worldwide for 36 cancers in 185 countries. CA Cancer J Clin. 2018;68(6):394–424. doi: 10.3322/caac.21492. - DOI - PubMed
    1. Herbst RS, Morgensztern D, Boshoff C. The biology and management of non-small cell lung cancer. Nature. 2018;553(7689):446–454. - PubMed
    1. Gorlova OY, Zhang Y, Schabath MB, Lei L, Zhang Q, Amos CI, et al. Never smokers and lung cancer risk: a case-control study of epidemiological factors. Int J Cancer. 2006;118(7):1798–1804. - PubMed
    1. Malhotra J, Malvezzi M, Negri E, la Vecchia C, Boffetta P. Risk factors for lung cancer worldwide. Eur Respir J. 2016;48(3):889–902. - PubMed
    1. Turner MC, Chen Y, Krewski D, Calle EE, Thun MJ. Chronic obstructive pulmonary disease is associated with lung cancer mortality in a prospective study of never smokers. Am J Respir Crit Care Med. 2007;176(3):285–290. - PubMed

Substances