. 2023 Jan 20;27(1):4.
doi: 10.1186/s40824-023-00342-5.

Verapamil-loaded supramolecular hydrogel patch attenuates metabolic dysfunction-associated fatty liver disease via restoration of autophagic clearance of aggregated proteins and inhibition of NLRP3

Affiliations

Verapamil-loaded supramolecular hydrogel patch attenuates metabolic dysfunction-associated fatty liver disease via restoration of autophagic clearance of aggregated proteins and inhibition of NLRP3

Do Kyung Kim et al. Biomater Res. .

Abstract

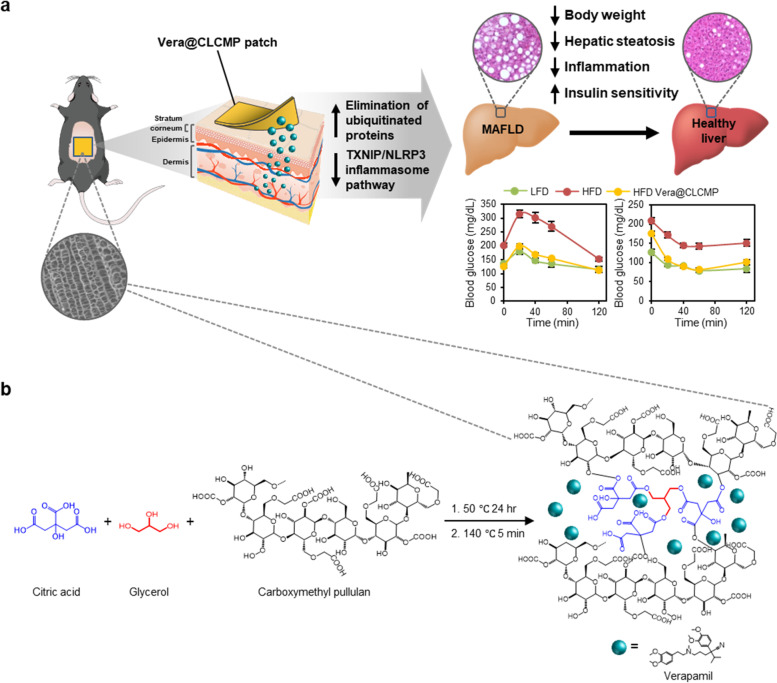
Background: Obesity, a serious threat to public health, is linked to chronic metabolic complications including insulin resistance, type-2 diabetes, and metabolic dysfunction-associated fatty liver disease (MAFLD). Current obesity medications are challenged by poor effectiveness, poor patient compliance, and potential side effects. Verapamil is an inhibitor of L-type calcium channels, FDA-approved for the treatment of hypertension. We previously investigated the effect of verapamil on modulating autophagy to treat obesity-associated lipotoxicity. This study aims to develop a verapamil transdermal patch and to evaluate its anti-obesity effects.

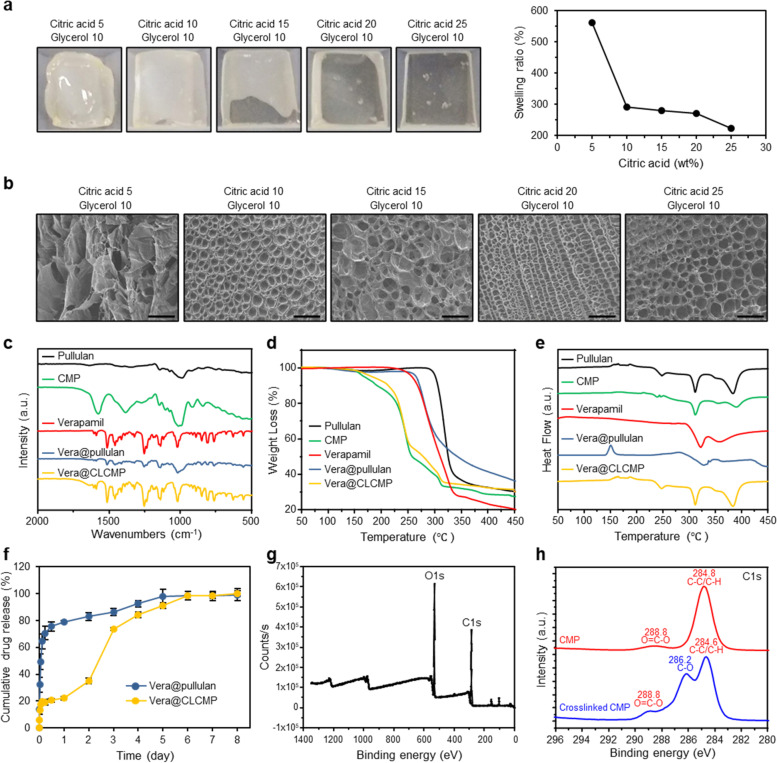
Methods: Verapamil is loaded in biomimetic vascular bundle-like carboxymethyl pullulan-based supramolecular hydrogel patches cross-linked with citric acid and glycerol linkages (CLCMP). The investigation was then carried out to determine the therapeutic effect of verapamil-loaded CLCMP (Vera@CLCMP) on diet-induced obese mice.

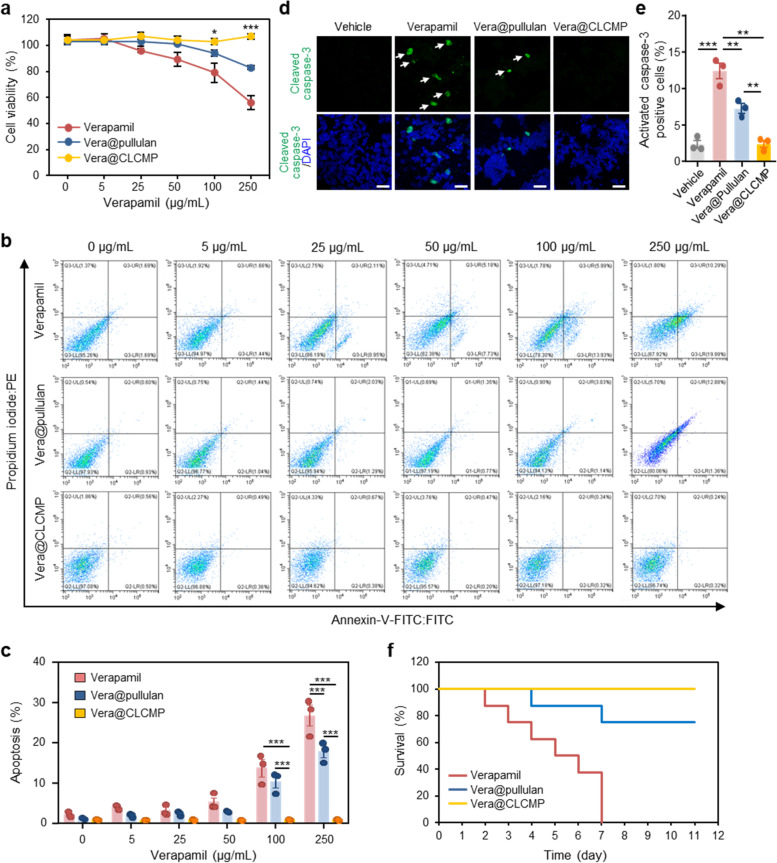
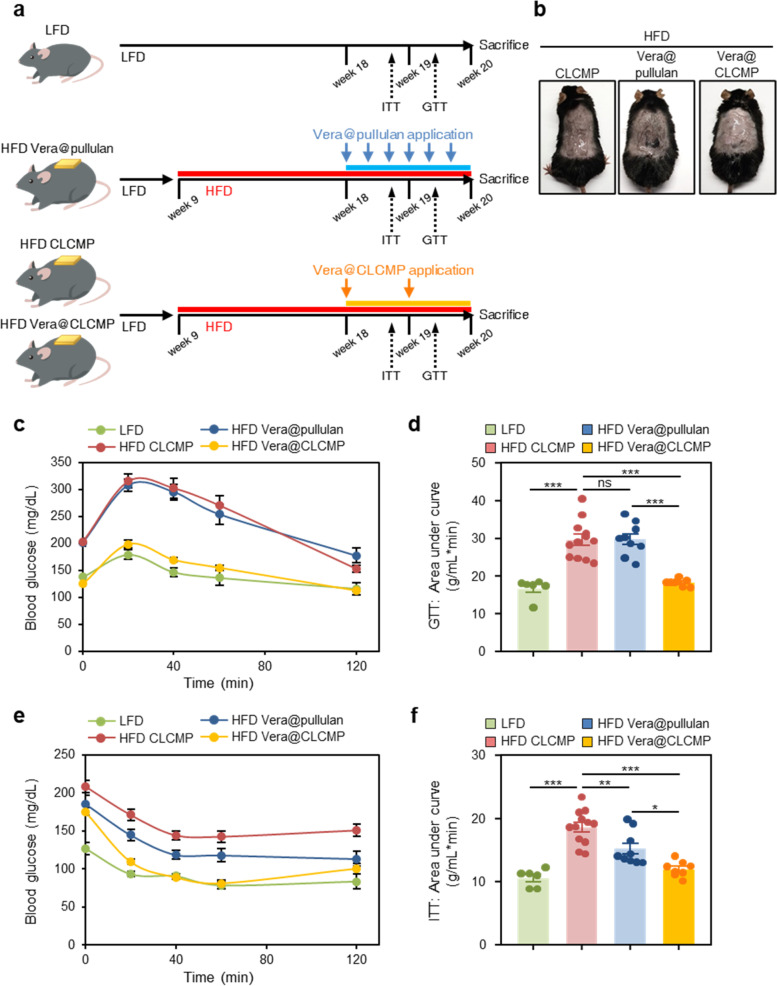
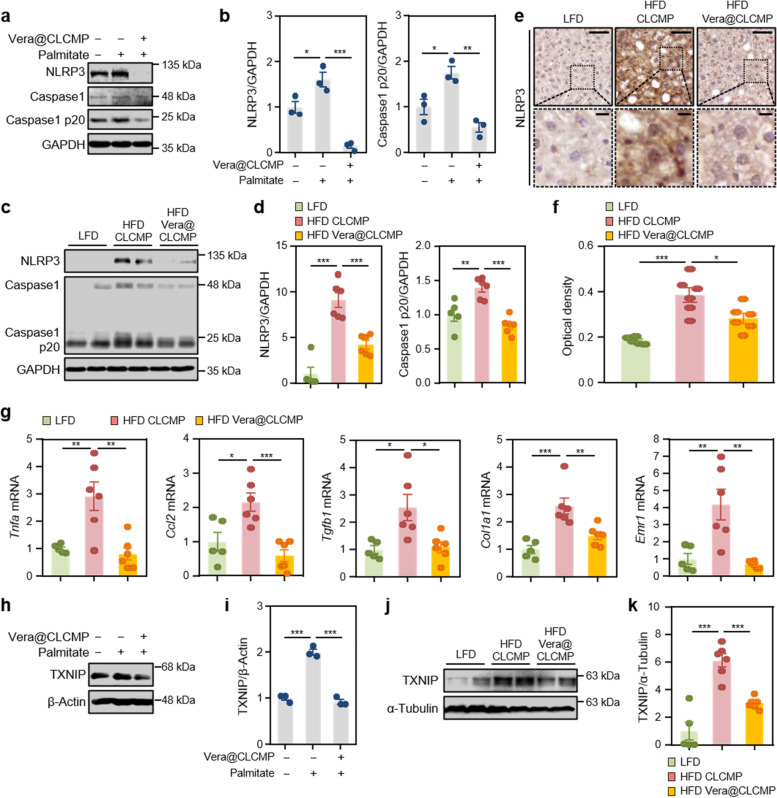
Results: Vera@CLCMP hydrogel patches with hierarchically organized and anisotropic pore structures not only improved verapamil bioavailability without modifying its chemical structure but also enhanced verapamil release through the stratum corneum barrier. Vera@CLCMP patches exhibit low toxicity and high effectiveness at delivering verapamil into the systemic circulation through the dermis in a sustained manner. Specifically, transdermal administration of this patch into diet-induced obese mice drastically improved glucose tolerance and insulin sensitivity and alleviated metabolic derangements associated with MAFLD. Furthermore, we uncovered a distinct molecular mechanism underlying the anti-obesity effects associated with the hepatic NLR family pyrin domain-containing 3 (NLRP3) inflammasome and autophagic clearance by the vera@CLCMP hydrogel patches.

Conclusion: The current study provides promising drug delivery platforms for long-term family treatment of chronic diseases, including obesity and metabolic dysfunctions.

Keywords: Autophagic clearance; Carboxymethyl pullulan; Hydrogel; Inflammasome; Metabolic associated fatty liver disease; Transdermal delivery.


Conflict of interest statement

The authors declare that they have no competing interests.

Figures

Fig. 1
Fig. 1
Synthesis and biomedical application of verapamil-loaded CLCMP (Vera@CLCMP) hydrogel patches. A Schematic illustration of Vera@CLCMP hydrogel patch attached to the mouse dorsal skin. Controlled release of the loaded verapamil in the superporous hydrogel system permeates to the stratum corneum or even deep dermis, thus reversing diet-induced obesity and insulin resistance. Vera@CLCMP patches attenuate obesity-induced metabolic dysregulation by improving autophagic clearance through regulation of CaMKII activity and NLRP3-inflammasome activation in hepatocytes. B Chemical structures schemes of Vera@CLCMP hydrogel patches
Fig. 2
Fig. 2
Characterization of pullulan patches containing verapamil (Vera@pullulan) and Vera@CLCMP patches. A Photographs of the Vera@CLCMP and swelling ratio depending on adding amount of citric acid. B SEM micrographs of the freeze-dried samples of 5–25 wt% citric acid and 10 wt% glycerol. Scale bar, 100 μm. (C) FT-IR spectra of pullulan, CLCMP, verapamil, Vera@pullulan, and Vera@CLCMP. D Thermogravimetric analysis (TGA) curves and (E) Differential scanning calorimeter (DSC) thermograms of pullulan, CLCMP, verapamil, Vera@pullulan, and Vera@CLCMP. F In vitro accumulated free verapamil release from Vera@pullulan and Vera@CLCMP patch in PBS at 37 °C. G, H Full range of X-ray photoelectron spectroscopy (XPS) spectra of CLCMP and XPS spectra of C-C/C-H, O=C-O and C-O of CMP and CLCMP. Data is shown as mean ± SEM
Fig. 3
Fig. 3
In vitro and in vivo toxicity of Vera@pullulan and Vera@CLCMP patches. a-c HepG2 cells were treated with the indicated concentration of verapamil dissolved in PBS, Vera@pullulan, and Vera@CLCMP patches, respectively, for 24 hrs. A Cell viability was measured by the WST-8 assay. B HepG2 cells were stained with annexin V-FITC and PI and then analyzed for apoptosis by flow cytometry. The percentage of apoptotic HepG2 cells are shown in (C). D Immunofluorescence staining for cleaved caspase-3 (green) in HepG2 cells treated with 250 μg/mL verapamil, 250 μg/mL Vera@pullulan, 250 μg/mL Vera@CLCMP, or PBS (vehicle) for 24 hrs. Nuclei were stained with DAPI (blue). White arrows show cleaved caspase-3 positive cells. Scale bar, 40 μm. E Caspase-3 activity was quantified. F Kaplan–Meier survival curve of mice treated daily with verapamil (50 mg/kg intraperitoneal [i.p.]), 50 mg/kg Vera@pullulan, and 50 mg/kg Vera@CLCMP patches, respectively, on day 0 (n = 6–14). Data is shown as mean ± SEM. *p < 0.05; ***p < 0.001 (One-way ANOVA, followed by Tukey’s test)
Fig. 4
Fig. 4
Vera@CLCMP patches improve glucose tolerance and insulin sensitivity. A Experimental design for in vivo treatment of high-fat diet (HFD)-induced obese mice. B Vera@pullulan or Vera@CLCMP patches were applied to the dorsal skin of mice in vivo. C-F Vera@pullulan or Vera@CLCMP patches were applied to the dorsal skin of C57BL/6 male mice kept on HFD. Low-fat diet (LFD)-fed mice of the same age were used as a negative control. Glucose tolerance test (GTT, C) and insulin tolerance test (ITT, E) were conducted using LFD-fed or HFD-fed mice treated with Vera@pullulan or Vera@CLCMP patch. Area under the curve was quantified from GTT (D) and ITT data (F). Data is shown as mean ± SEM. *p < 0.05; **p < 0.01; ***p < 0.001 (One-way ANOVA, followed by Tukey’s test)
Fig. 5
Fig. 5
In vivo imaging and biodistribution of Vera-FITC@CLCMP patch in mice. A Photographs of verapamil and verapamil-FITC conjugate solutions under daylight and UV light for 365 nm excitation wavelength. B Vera-FITC@pullulan or Vera-FITC@CLCMP patches were applied to the dorsal skin of hairless mice. C Fluorescence imaging of mice at 1–4 days after treatment with CLCMP, Vera-FITC@pullulan, or Vera-FITC@CLCMP patches. D Fluorescence intensity was quantified. E Fluorescence imaging of histological sections of the dorsal skin of mice treated with Vera-FITC@CLCMP patch at indicated time points. Nuclei were stained with DAPI (blue). Scale bar, 100 μm. A line scan across the marked line is shown in (F). G Ex vivo fluorescence imaging of heart, liver, spleen, lung, kidney, and pancreas at 1 day and 4 days after treatment with CLCMP, Vera-FITC, Vera@pullulan, or Vera-FITC@CLCMP patches. H Fluorescence intensity of each organ was quantified. Data is shown as mean ± SEM. ***p < 0.001 (One-way ANOVA, followed by Tukey’s test)
Fig. 6
Fig. 6
Vera@CLCMP improves palmitate-induced protein aggregation. A-H HepG2 cells were treated with 500 μM palmitate or BSA (vehicle) for 12 h in the presence or absence of the release medium and incubated with 38.35 μg/mL Vera@CLCMP at 37 °C for indicated periods. A, C Triton X-100-soluble and -insoluble fractions of cell lysates were immunoblotted with anti-ubiquitin and anti-p62 antibodies. β-actin served as a loading control. B, D Band intensities were quantified and normalized to control levels. E, G Immunofluorescence staining for ubiquitin (green) and p62 (red) in HepG2 cells with indicated treatments. Nuclei were stained with DAPI (blue). Scale bar, 5 μm. F, H Sizes of ubiquitin and p62 aggregates were quantified. Data is shown as mean ± SEM. *p < 0.05; **p < 0.01; ***p < 0.001 (One-way ANOVA, followed by Tukey’s test)
Fig. 7
Fig. 7
Vera@CLCMP patches reverse diet-induced obesity and hepatic steatosis. A-L C57BL/6 male mice kept on HFD for 9 weeks had Vera@CLCMP or CLCMP patches applied to the dorsal skin. LFD-fed mice of the same age were used as a negative control. A Body weight of mice fed a HFD and treated with Vera@CLCMP or CLCMP patches. B Food intake during treatment period. C Gross liver morphology and D total liver mass of mice in each group indicated. E-G Serum ALT, AST, and ALP levels. H H&E staining (upper) and Oil-Red O staining (lower) of liver sections from mice in each group indicated. Scale bar, 100 μm. I Histological MAFLD activity score (NAS). J Oil-Red O-stained area was quantified. K H&E staining of epididymal white adipose tissue from mice in each group indicated. Scale bar, 100 μm. L Average adipocyte area of epididymal white adipose tissue was quantified. Data is shown as mean ± SEM. *p < 0.05; **p < 0.01; ***p < 0.001 (One-way ANOVA, followed by Tukey’s test)
Fig. 8
Fig. 8
Vera@CLCMP patches improve the accumulation of ubiquitinated proteins by inhibiting the activation of CaMKII. A-H C57BL/6 male mice kept on HFD for 9 weeks had Vera@CLCMP or CLCMP patches applied to the dorsal skin. LFD-fed mice of the same age were used as a negative control. A, C Triton X-100-soluble and-insoluble fractions of liver tissue lysates were immunoblotted with anti-ubiquitin and anti-p62 antibodies. α-tubulin served as a loading control. B, D Band intensities were quantified and normalized to control levels. E Immunohistochemical staining for p62 in liver tissues from mice in each group. Boxed areas are magnified in the bottom panels. Scale bars, 50 μm; 10 μm (insets). F Optical density of p62 immunoreactivity. G Liver tissues were collected from mice in each group and analyzed by immunoblotting with anti-phospho-CaMKII antibody. α-tubulin served as a loading control. H Band intensities were quantified and normalized to the CaMKII intensities. Data is shown as mean ± SEM. *p < 0.05; **p < 0.01; ***p < 0.001; ns, not significant (One-way ANOVA, followed by Tukey’s test)
Fig. 9
Fig. 9
Vera@CLCMP patches ameliorate NLRP3-inflammasome activation by inhibiting the expression of TXNIP. A, B, H, I HepG2 cells were treated with 100 μM palmitate or BSA (vehicle) for 24 h in the presence or absence of a release medium incubated with 38.35 μg/mL Vera@CLCMP at 37 °C for 6 days. Cell lysates were immunoblotted with anti-NLRP3 and anti-caspase-1 (A) or anti-TXNIP (H) antibodies. GAPDH or α-tubulin served as a loading control. B, I Band intensities were quantified and normalized to control band intensities. C-G, J, K C57BL/6 male mice kept on HFD for 9 weeks had Vera@CLCMP or CLCMP patches applied on their dorsal skin. LFD-fed mice of the same age were used as a negative control. C Liver tissue lysates were immunoblotted with anti-NLRP3 and anti-caspase-1 antibodies. GAPDH served as a loading control. D Band intensities were quantified and normalized to control band intensities. E Immunohistochemical staining for NLRP3 in liver tissues from mice in each group indicated. Boxed areas are magnified in the bottom panels. Scale bars, 50 μm; 10 μm (insets). F Optical density of NLRP3 immunoreactivity. G qRT-PCR analysis of Tnfa, Ccl2, Tgfb1, Col1a1, and Emr1 mRNA levels in liver tissues from mice in each group indicated. J Liver tissue lysates were immunoblotted with anti-TXNIP antibody. α-tubulin served as a loading control. K Band intensities were quantified and normalized to control band intensities. Data is shown as mean ± SEM. *p < 0.05; **p < 0.01; ***p < 0.001 (One-way ANOVA, followed by Tukey’s test)

Similar articles

Cited by

References

    1. Olefsky JM, Glass CK. Macrophages, inflammation, and insulin resistance. Annu Rev Physiol. 2010;72:219–246. doi: 10.1146/annurev-physiol-021909-135846. - DOI - PubMed
    1. Doria A, Patti ME, Kahn CR. The emerging genetic architecture of type 2 diabetes. Cell Metab. 2008;8:186–200. doi: 10.1016/j.cmet.2008.08.006. - DOI - PMC - PubMed
    1. Asrih M, Jornayvaz FR. Inflammation as a potential link between nonalcoholic fatty liver disease and insulin resistance. J Endocrinol. 2013;218:R25–R36. doi: 10.1530/JOE-13-0201. - DOI - PubMed
    1. Godoy-Matos AF, Silva Junior WS, Valerio CM. NAFLD as a continuum: from obesity to metabolic syndrome and diabetes. Diabetol Metab Syndr. 2020;12:60. doi: 10.1186/s13098-020-00570-y. - DOI - PMC - PubMed
    1. Eslam M, Newsome PN, Sarin SK, Anstee QM, Targher G, Romero-Gomez M, Zelber-Sagi S, Wai-Sun Wong V, Dufour JF, Schattenberg JM, et al. A new definition for metabolic dysfunction-associated fatty liver disease: an international expert consensus statement. J Hepatol. 2020;73:202–209. doi: 10.1016/j.jhep.2020.03.039. - DOI - PubMed