. 2023 Apr 3;191(4):2353-2366.
doi: 10.1093/plphys/kiad028.

Phytochrome F mediates red light responsiveness additively with phytochromes B1 and B2 in tomato

Affiliations

Phytochrome F mediates red light responsiveness additively with phytochromes B1 and B2 in tomato

Daniel Balderrama et al. Plant Physiol. .

Abstract

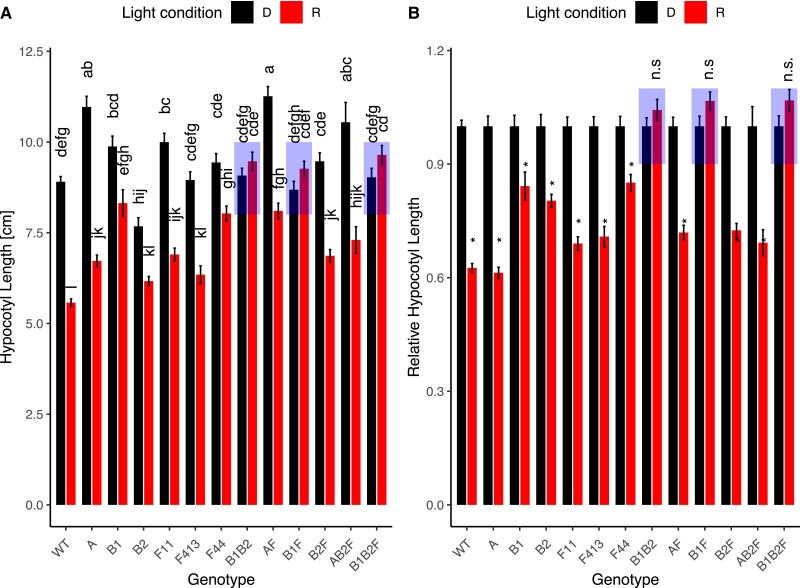
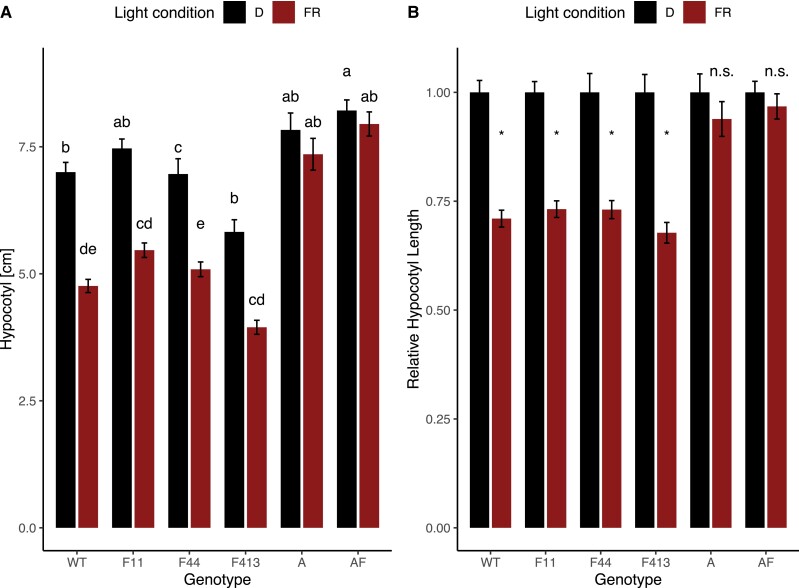
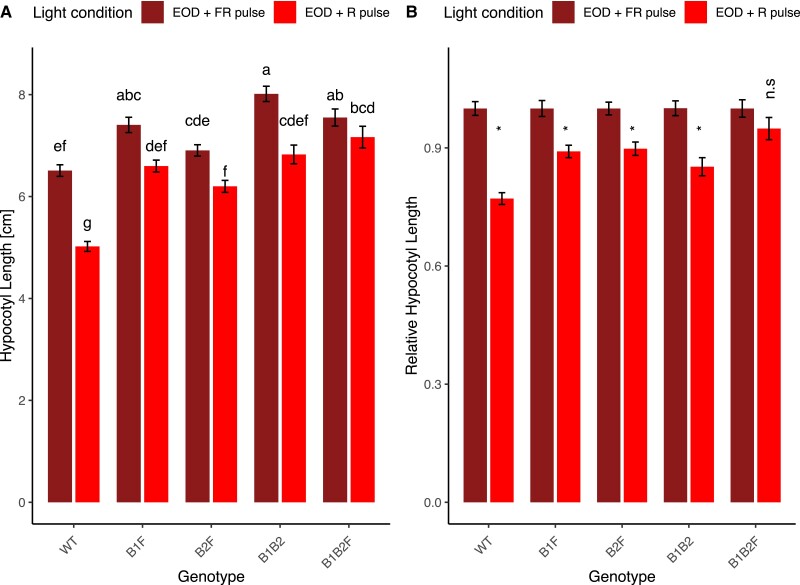
Phytochromes are red light and far-red light sensitive, plant-specific light receptors that allow plants to orient themselves in space and time. Tomato (Solanum lycopersicum) contains a small family of five phytochrome genes, for which to date stable knockout mutants are only available for three of them. Using CRISPR technology, we created multiple alleles of SlPHYTOCHROME F (phyF) mutants to determine the function of this understudied phytochrome. We report that SlphyF acts as a red/far-red light reversible low fluence sensor, likely through the formation of heterodimers with SlphyB1 and SlphyB2. During photomorphogenesis, phyF functions additively with phyB1 and phyB2. Our data further suggest that phyB2 requires the presence of either phyB1 or phyF during seedling de-etiolation in red light, probably via heterodimerization, while phyB1 homodimers are required and sufficient to suppress hypocotyl elongation in red light. During the end-of-day far-red response, phyF works additively with phyB1 and phyB2. In addition, phyF plays a redundant role with phyB1 in photoperiod detection and acts additively with phyA in root patterning. Taken together, our results demonstrate various roles for SlphyF during seedling establishment, sometimes acting additively, other times acting redundantly with the other phytochromes in tomato.


Conflict of interest statement

Conflict of interest statement. None declared.

Figures

Figure 1
Figure 1
Molecular structure of CRISPR-induced phyF alleles. A: Structure of PHYF indicating the location of gRNA target sequences in exon 1 and the location of the genotyping primers (see Supplemental Table 1). The forward and reverse priming sites are indicated by the left and right pink vertical bars, respectively, underneath the gene model. The gRNA target sequences are shown as gray vertical bars under the gene model. B-D: Alignments of mutations in phyF-11, phyF-44, and phyF-413, respectively. The color-coded sequence (top line) depicts part of exon 1 of wild-type PHYF. The gRNA target sites and the corresponding protospacer adjacent motif (PAM) sites are shown in orange and yellow, respectively. Insertion and deletion mutations are indicated by red bars between the sequences. Premature TGA stop codons resulting from CRISPR-induced mutations are indicated in the top sequence in red.
Figure 2
Figure 2
Loss of phyF when combined with loss of phyB1 affects the reduction of hypocotyl growth during photomorphogenesis in Rc. Seeds were germinated in the dark for 3–4 days. Synchronously germinated seedlings were transferred to R and allowed to grow for 4 days in Rc (15 µE), before being photographed, and analyzed using ImageJ as described in the Methods. Data were statistically analyzed using 2-way ANOVA, which showed a significant effect of interaction between genotype and light condition on hypocotyl length (P < 0.001). The data were subsequently analyzed with a Tukey post hoc test. Means not connected by the same letter are statistically significantly different from each other at P < 0.05. An asterisk indicates statistical significance at P < 0.05 from the dark treatment. For each genotype, four biological replicates were performed with similar results and data were pooled for this figure. Sample sizes were as follows (dark/red): A (phyA) = 112 (55/57), AB2F (phyAB2F) = 40 (16/24), AF (phyAF) = 122 (62/60), B1 (phyB1) = 91 (41/50), B1B2 (phyB1B2) = 99 (50/49), B1B2F (phyB1B2F) = 102 (55/47), B1F (phyB1F) = 96 (48/48), B2 (phyB2) = 107 (53/54), B2F (phyB2F) = 40 (17/24), F11 (phyF-11) = 113 (59/54), F413 (phyF-413) = 96 (46/50), F44 (phyF-44) = 119 (57/62), Wild-type cv. Moneymaker (WT) = 295 (141/154). Error bars reflect SE. The genotype phyB1B2F contained a mutation in a presumably unrelated second gene. A: shows data as absolute values; B: shows data as values relative to the dark response. Both A and B use the same data set. Shaded boxes are used to highlight the only three genotypes not responding to Rc. Rc = continuous red light; D = dark, R = red light; n.s. = not significant.
Figure 3
Figure 3
The photoperiod response in three-week-old seedlings is mediated redundantly by phyB1 and phyF. Seeds were germinated in darkness for 3–4 days and synchronously germinated seedlings transplanted and grown in experimental conditions for another 7 days. To ensure that only the photoperiod, and not also irradiance differed between treatments, the light intensity in the two conditions was adjusted such that seedlings experienced a similar total irradiance over a 24 h time period. Ten-day-old seedlings were measured using ImageJ. Two-way ANOVA showed a significant effect of interaction between photoperiod and genotype on hypocotyl growth (P < 0.001). Subsequently, a Tukey post hoc test was performed. Means not connected by the same letter are statistically significantly different from each other at P < 0.05. For each genotype, at least four biological replicates were performed and data were pooled for this figure. Sample sizes were as follows (LD/SD): B1 = 179 (94/85), B1F = 124 (64/60), F11 = 190 (88/102), WT = 204 (105/99). Error bars reflect SE. LD = long days, SD = short days. Gene abbreviations are as in Figure 2.
Figure 4
Figure 4
Unlike PHYA, PHYF is not required for the response to FRc light. Seeds were germinated in the dark for 3–4 days. Seedlings were selected for synchronous germination and transferred to experimental conditions for four additional days as described in the Methods and measured using ImageJ. A two-way ANOVA showed a significant effect of interaction between genotype and light condition on hypocotyl length (P < 0.001). Tukey post hoc analysis was subsequently performed. Means not connected by the same letter are statistically significantly different from each other at P < 0.05. An asterisk indicates statistical significance at P < 0.05 from the dark treatment. For each genotype, at least three biological replicates were performed and data pooled for this figure. Sample sizes were as follows (dark/far-red): A = 71 (38/33), AF = 84 (46/38), F11 = 105 (53/52), F413 = 81 (38/43), F44 = 90 (40/50), WT = 106 (55/51). Error bars reflect SE. Gene abbreviations are as in Figure 2. A: shows data as absolute values; B: shows data as values relative to the dark response. Both A and B use the same data set. FRc = continuous far-red light; D = dark, FR = far-red light; n.s. = not significant.
Figure 5
Figure 5
PHYA, but not PHYF, is required for FR reversibility to a R pulse. Seeds were germinated in the dark for 3–4 days. Synchronously germinated seedlings were transferred to experimental conditions. Seedlings were treated with pulses of R, R followed by FR, or kept in the dark, as described in the Materials and Methods. After four days in experimental conditions, plants were photographed and hypocotyl lengths measured using ImageJ. A 2-way ANOVA showed a significant effect of interaction between genotype and light condition on hypocotyl growth (P < 0.001). Subsequently, a Tukey posthoc test was performed. Means not connected by the same letter are statistically significantly different from each other at P < 0.05. An asterisk indicates statistical significance at P < 0.05 from the dark treatment. For each genotype, at least four biological replicates were performed and data pooled for this figure. Sample sizes were as follows (dark/red/red + far-red): A = 130 (42/44/44), AF = 133 (43/49/41), F11 = 122 (39/42/41), F413 = 124 (40/43/41), F44 = 122 (36/48/38), WT = (41/54/42). Error bars reflect SE. Gene abbreviations are as in Figure 2. A: shows data as absolute values; B: shows data as values relative to the dark response. Both A and B use the same data set. D = dark, R = red light; RFR = red light followed by a far-red pulse; n.s. = not significant.
Figure 6
Figure 6
PhyF plays a role in the response to end-of-day treatment with FR. Seeds were germinated in darkness for 3–4 days and synchronously germinated seedlings transplanted and grown in experimental conditions for an additional four days. Seedlings were then measured using ImageJ. Two-way ANOVA showed a significant effect of interaction between light treatment and genotype on hypocotyl growth (P < 0.001). Subsequently, a Tukey post hoc test was performed. Means not connected by the same letter are statistically significantly different from each other at P < 0.05. An asterisk indicates statistical significance at P < 0.05 from the dark treatment. For each genotype, five biological replicates were performed and data were pooled for this figure. Sample sizes were as follows (EOD + FR/EOD + R): B1F = 115 (45/70), B2F = 121 (68/53), B1B2 = 132 (78/54), B1B2F = 128 (63/65), WT = 151 (75/76). Error bars reflect SE. The genotype phyB1B2F contained a mutation in a presumably unrelated second gene. Gene abbreviations are as in Figure 2. A: shows data as absolute values; B: shows data as values relative to the dark response. Both A and B use the same data set. EOD + FR pulse = end-of-day plus FR treatment, EOD + R = end-of-day plus R treatment. FR = far-red light; R = red light; n.s. = not significant.
Figure 7
Figure 7
Taproot length is additively regulated by both phyA and phyF. Seeds were germinated and grown in vermiculite soaked in Hoagland solution and grown for 3 weeks. Roots were photographed and analyzed using ImageJ. A: The length of the longest taproot was measured and analyzed using one-way ANOVA (P < 0.001) followed by Tukey post hoc analysis. B: The total number of side roots were counted and analyzed by a one-way ANOVA (P = 0.116), showing they did not differ between genotypes. Means not connected by the same letter are statistically significantly different from each other at P < 0.05. Sample sizes for both experiments were as follows: A = 54, AF = 64, F11 = 54, WT = 64. Error bars reflect SE. Gene abbreviations are as in Figure 2.
Figure 8
Figure 8
PHYF is expressed weakly to moderately in hypocotyls and other young tissue but is more strongly expressed in older tissues. Data were mined from the Transcriptome Variation Analysis database http://travadb.org/and visualized using R software. Each gene's expression patterns are normalized against their highest expression value (darkest shade of red). Lower expression levels correspond to lower color values/lighter shades/yellow, higher expression levels correspond to higher color values/darker shades/red-brown.

References

    1. Alba R, Kelmenson PM, Cordonnier-Pratt M-M, Pratt LH (2000) The phytochrome gene family in tomato and the rapid differential evolution of this family in angiosperms. Mol Biol Evol 17(3): 362–373 - PubMed
    1. Boccalandro HE, Rugnone ML, Moreno JE, Ploschuk EL, Serna L, Yanovsky MJ, Casal JJ (2009) Phytochrome B enhances photosynthesis at the Expense of water-use efficiency in Arabidopsis. Plant Physiol 150(2): 1083. - PMC - PubMed
    1. Brooks C, Nekrasov V, Lippman ZB, Van Eck J (2014) Efficient gene editing in tomato in the first generation using the clustered regularly interspaced short palindromic repeats/CRISPR-Associated9 system. Plant Physiol 166(3): 1292. - PMC - PubMed
    1. Carlson KD, Bhogale S, Anderson D, Tomanek L, Madlung A (2019) Phytochrome A regulates carbon flux in dark grown tomato seedlings. Front Plant Sci 10: 152. - PMC - PubMed
    1. Carlson KD, Bhogale S, Anderson D, Zaragoza-Mendoza A, Madlung A (2020) Subfunctionalization of phytochrome B1/B2 leads to differential auxin and photosynthetic responses. Plant Direct 4(2): e00205 - PMC - PubMed

Publication types