. 2023 Jan 13;13(2):274.
doi: 10.3390/ani13020274.

The Different Fate of the Pyrenean Desman (Galemys pyrenaicus) and the Eurasian Otter (Lutra lutra) under Climate and Land Use Changes

Affiliations

The Different Fate of the Pyrenean Desman (Galemys pyrenaicus) and the Eurasian Otter (Lutra lutra) under Climate and Land Use Changes

Luca Francesco Russo et al. Animals (Basel). .

Abstract

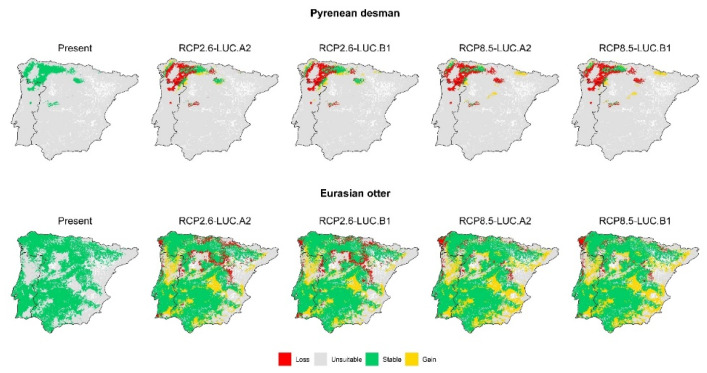
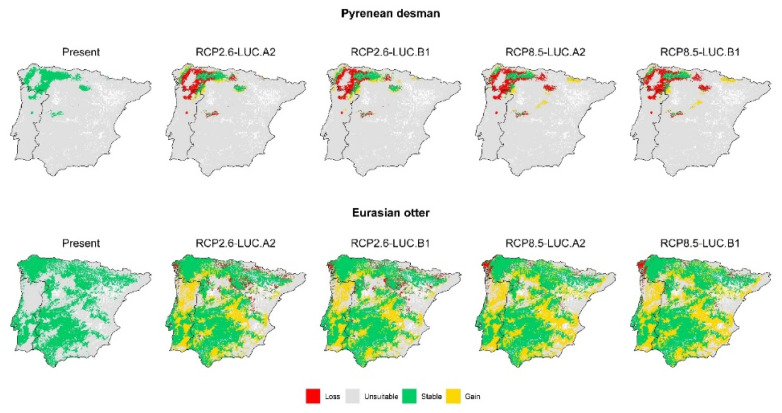
Climate and land use change can affect biodiversity in different ways, e.g., determining habitat loss, altering reproduction periods or disrupting biotic interactions. Here, we investigate the effects of climate and land use change on the spatial distribution of two semi-aquatic mammals, the Pyrenean desman (Galemys pyrenaicus) and the Eurasian otter (Lutra lutra). We first modeled the current potential distribution of the desman and the otter in the Iberian Peninsula, considering topographic, climatic and land use variables. Second, we predicted their potential distribution in 2050 under climate and land use change scenarios. We calculated the percentage of range gain/loss and shift predicted for the two species under such scenarios and quantified the present and future spatial overlap between the two species distribution. Irrespective of the scenario, desman models show loss of suitable habitat, whereas the otter will undergo an opposite trend. Aside from a preponderant habitat loss, the desman is predicted to increase its spatial overlap with otter range under the optimistic scenarios, potentially meaning it will face an exacerbated predation by otters. The potential increase of both habitat loss and otters' predation might represent a major threat for the desman, which may affect the long-term persistence of this endemic species in the Iberian Peninsula.

Keywords: Galemys pyrenaicus; Lutra lutra; climate change; land use change; predator–prey interactions; species distribution models.


Conflict of interest statement

The authors declare no conflict of interest.

Figures

Figure A1
Figure A1
Distribution in the Iberian peninsula of the occurrence data of the desman (n = 251) from 2013 to 2020 and the otter (n = 1912) from 2000 to 2020, after the thinning procedure by the “spThin” R package [38].
Figure A2
Figure A2
Spatially explicit predictions of desman and otter range modifications under 2050 climate and land use change scenarios, as generated by the IPSL-CM5A-LR global circulation model and the “maximize TSS” binarization threshold. Grey: stable unsuitable habitat, red: habitat loss, green: stable suitable habitat, yellow: habitat gain.
Figure A3
Figure A3
Spatially explicit predictions of desman and otter range modifications under 2050 climate and land use change scenarios, as generated by the IPSL-CM5A-LR global circulation model and the “mean occurrence probability”, binarization threshold. Grey: stable unsuitable habitat, red: habitat loss, green: stable suitable habitat, yellow: habitat gain.
Figure A4
Figure A4
Spatially explicit predictions of desman and otter range modifications under 2050 climate and land use change scenarios, as generated by the IPSL-CM5A-LR global circulation model and the “equalize sensitivity and specificity”, binarization threshold. Grey: stable unsuitable habitat, red: habitat loss, green: stable suitable habitat, yellow: habitat gain.
Figure A5
Figure A5
Spatially explicit predictions of desman and otter range modifications under 2050 climate and land use change scenarios, as generated by the IPSL-CM5A-LR global circulation model and the “minimize receiver operating characteristic plot distance”, binarization threshold. Grey: stable unsuitable habitat, red: habitat loss, green: stable suitable habitat, yellow: habitat gain.
Figure A6
Figure A6
Spatially explicit predictions of desman and otter range modifications under 2050 climate and land use change scenarios, as generated by the CCSM4 global circulation model and the “maximize TSS” binarization threshold. Grey: stable unsuitable habitat, red: habitat loss green: stable suitable habitat, yellow: habitat gain.
Figure A7
Figure A7
Spatially explicit predictions of desman and otter range modifications under 2050 climate and land use change scenarios, as generated by the CCSM4 global circulation model and the “mean occurrence probability”, binarization threshold. Grey: stable unsuitable habitat, red: habitat loss green: stable suitable habitat, yellow: habitat gain.
Figure A8
Figure A8
Spatially explicit predictions of desman and otter range modifications under 2050 climate and land use change scenarios, as generated by the CCSM4 global circulation model and the “equalize sensitivity and specificity”, binarization threshold. Grey: stable unsuitable habitat, red: habitat loss, green: stable suitable habitat, yellow: habitat gain.
Figure A9
Figure A9
Spatially explicit predictions of desman and otter range modifications under 2050 climate and land use change scenarios, as generated by the CCSM4 global circulation model and the “minimize receiver operating characteristic plot distance”, binarization threshold. Grey: stable unsuitable habitat, red: habitat loss, green: stable suitable habitat, yellow: habitat gain.
Figure A10
Figure A10
Spatially explicit predictions of desman and otter range modifications under 2050 climate and land use change scenarios, as generated by the MIROC-ESM-CHEM global circulation model and the “maximize TSS” binarization threshold. Grey: stable unsuitable habitat, red: habitat loss, green: stable suitable habitat, yellow: habitat gain.
Figure A11
Figure A11
Spatially explicit predictions of desman and otter range modifications under 2050 climate and land use change scenarios, as generated by the MIROC-ESM-CHEM global circulation model and the “mean occurrence probability”, binarization threshold. Grey: stable unsuitable habitat, red: habitat loss, green: stable suitable habitat, yellow: habitat gain.
Figure A12
Figure A12
Spatially explicit predictions of desman and otter range modifications under 2050 climate and land use change scenarios, as generated by the MIROC-ESM-CHEM global circulation model and the “equalize sensitivity and specificity”, binarization threshold. Grey: stable unsuitable habitat, red: habitat loss, green: stable suitable habitat, yellow: habitat gain.
Figure A13
Figure A13
Spatially explicit predictions of desman and otter range modifications under 2050 climate and land use change scenarios, as generated by the MIROC-ESM-CHEM global circulation model and the “minimize receiver operating characteristic plot distance”, binarization threshold. Grey: stable unsuitable habitat, red: habitat loss, green: stable suitable habitat, yellow: habitat gain.
Figure 1
Figure 1
Bar plot depicting variables importance for desman and response curves depicting the shape of the relationship between desman habitat suitability and each environmental variable included into the ensemble model.
Figure 2
Figure 2
Bar plot depicting variables importance for otter and response curves depicting the shape of the relationship between otter habitat suitability and each environmental variable included into the ensemble model.
Figure 3
Figure 3
Percentage of range net change and shift for the desman and the otter under current time and the four 2050 global change scenarios. The variation depicted in each box plot refers to net change and shift values as generated by the three global circulation models and the four binarization thresholds.
Figure 4
Figure 4
Spatially explicit predictions of desman and otter range modifications under 2050 climate and land use change scenarios, as generated by the IPSL-CM5A-LR global circulation model and the “equalize sensitivity and specificity” binarization threshold. Grey: stable unsuitable habitat, red: habitat loss, green: stable suitable habitat, yellow: habitat gain.
Figure 5
Figure 5
Percentage of overlap between the desman and otter ranges of distribution today and under the four 2050 global change scenarios. The variation depicted in each box plot refers to overlap values as generated by the three global circulation models and the four binarization thresholds.

Similar articles

Cited by

References

    1. Ceballos G., Ehrlich P.R., Barnosky A.D., García A., Pringle R.M., Palmer T.M. Accelerated Modern Human-Induced Species Losses: Entering the Sixth Mass Extinction. Sci. Adv. 2015;1:9–13. doi: 10.1126/sciadv.1400253. - DOI - PMC - PubMed
    1. Sirami C., Caplat P., Popy S., Clamens A., Arlettaz R., Jiguet F., Brotons L., Martin J.L. Impacts of Global Change on Species Distributions: Obstacles and Solutions to Integrate Climate and Land Use. Glob. Ecol. Biogeogr. 2017;26:385–394. doi: 10.1111/geb.12555. - DOI
    1. Ohlemüller R., Anderson B.J., Araújo M.B., Butchart S.H.M., Kudrna O., Ridgely R.S., Thomas C.D. The Coincidence of Climatic and Species Rarity: High Risk to Small-Range Species from Climate Change. Biol. Lett. 2008;4:568–572. doi: 10.1098/rsbl.2008.0097. - DOI - PMC - PubMed
    1. Hof A.R., Jansson R., Nilsson C. Future Climate Change Will Favour Non-Specialist Mammals in the (Sub)Arctics. PLoS ONE. 2012;7:52574. doi: 10.1371/journal.pone.0052574. - DOI - PMC - PubMed
    1. Pacifici M., Rondinini C., Rhodes J.R., Burbidge A.A., Cristiano A., Watson J.E.M., Woinarski J.C.Z., Di Marco M. Global Correlates of Range Contractions and Expansions in Terrestrial Mammals. Nat. Commun. 2020;11:2840. doi: 10.1038/s41467-020-16684-w. - DOI - PMC - PubMed

LinkOut - more resources