. 2023 Jan 3;13(1):95.
doi: 10.3390/biom13010095.

Metabolomic Profiling in Patients with Different Hemodynamic Subtypes of Severe Aortic Valve Stenosis

Affiliations

Metabolomic Profiling in Patients with Different Hemodynamic Subtypes of Severe Aortic Valve Stenosis

Philipp Bengel et al. Biomolecules. .

Abstract

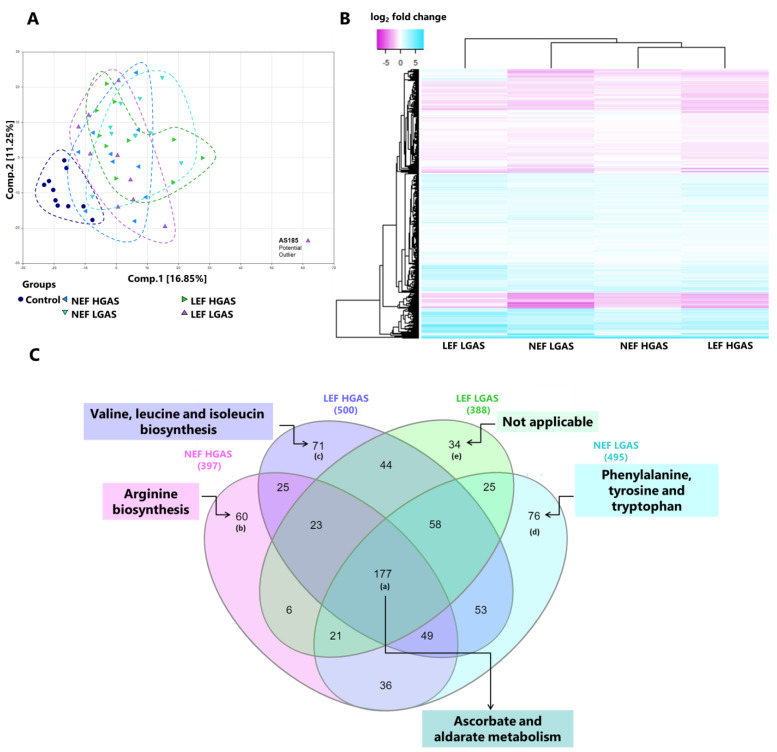
Severe aortic stenosis (AS) is a common pathological condition in an ageing population imposing significant morbidity and mortality. Based on distinct hemodynamic features, i.e., ejection fraction (EF), transvalvular gradient and stroke volume, four different AS subtypes can be distinguished: (i) normal EF and high gradient, (ii) reduced EF and high gradient, (iii) reduced EF and low gradient, and (iv) normal EF and low gradient. These subtypes differ with respect to pathophysiological mechanisms, cardiac remodeling, and prognosis. However, little is known about metabolic changes in these different hemodynamic conditions of AS. Thus, we carried out metabolomic analyses in serum samples of 40 AS patients (n = 10 per subtype) and 10 healthy blood donors (controls) using ultrahigh-performance liquid chromatography-tandem mass spectroscopy. A total of 1293 biochemicals could be identified. Principal component analysis revealed different metabolic profiles in all of the subgroups of AS (All-AS) vs. controls. Out of the determined biochemicals, 48% (n = 620) were altered in All-AS vs. controls (p < 0.05). In this regard, levels of various acylcarnitines (e.g., myristoylcarnitine, fold-change 1.85, p < 0.05), ketone bodies (e.g., 3-hydroxybutyrate, fold-change 11.14, p < 0.05) as well as sugar metabolites (e.g., glucose, fold-change 1.22, p < 0.05) were predominantly increased, whereas amino acids (e.g., leucine, fold-change 0.8, p < 0.05) were mainly reduced in All-AS. Interestingly, these changes appeared to be consistent amongst all AS subtypes. Distinct differences between AS subtypes were found for metabolites belonging to hemoglobin metabolism, diacylglycerols, and dihydrosphingomyelins. These findings indicate that relevant changes in substrate utilization appear to be consistent for different hemodynamic subtypes of AS and may therefore reflect common mechanisms during AS-induced heart failure. Additionally, distinct metabolites could be identified to significantly differ between certain AS subtypes. Future studies need to define their pathophysiological implications.

Keywords: heart failure; hemodynamic subgroups; metabolic remodeling; metabolomics; severe aortic valve stenosis.


Conflict of interest statement

The authors declare no conflict of interest.

Figures

Figure 1
Figure 1
Metabolomic fingerprints in AS subgroups and healthy controls. (A) Principal component analysis (PCA). (B) Heat map representing hierarchical clustering of differentially abundant metabolites. Metabolites were ordered by euclidian distance and average linkage according to the ratios of abundance in each AS subgroup when compared to controls. Each row represents an individual metabolite, and each column represents patient group. Pseudocolors indicate differential abundance (blue, pink, white representing metabolite levels above, below or equal to the mean on a log2 scale, respectively). (C) Venn diagram showing differentially regulated metabolites and pathways shared or unique among the different groups. The numerical values on the Venn diagram depicted the number of regulated metabolites.
Figure 2
Figure 2
Pathway analysis. (A) The most altered functional metabolic pathways among all AS subgroups. (BD) Unique altered functional metabolic pathways in each AS subgroup. The enrichment analysis was implemented using the hypergeometric test to evaluate whether a particular metabolite set is represented more than expected by chance within the given compound list. One-tailed p values are provided after adjusting for multiple testing.
Figure 3
Figure 3
Altered metabolism of fatty acids. (A) Illustration of fatty acid uptake to the mitochondria by transfer of acyl-residues to acylcarnitine. (B) List of altered aclycarnitines between AS patients and healthy controls (significantly regulated molecules marked in red). Values marked in light red indicate a trend towards statistical significance (0.05 < p < 0.10). Non-colored values are not significantly different for that comparison. Numbers indicate x-fold increase in concentration. * p ≤ 0.05. (C,D) Palmitoylcarnitine (C16) and myristoylcarnitine (C14) as examples between All-AS vs. controls as well as the different AS subgroups. On each box, the black cross indicates the mean value, the borders and segmentation indicate limits of upper/lower quartile and median values. Outliers are plotted as circles. n.s.: not significant between AS subgroups.
Figure 4
Figure 4
Ketone bodies in AS and healthy controls. (A) Illustration of ketone body utilization for energy production via TCA cycle. (B) List of significantly altered ketone bodies between All-AS group and controls (significantly regulated molecules marked in red, numbers indicate x-fold increase in concentration). (C,D) 3-Hydroxbutyrate (BHBA) and acetoacetate as examples between All-AS vs. controls as well as the different AS subgroups. On each box, the black cross indicates the mean value, the borders and segmentation indicate limits of upper/lower quartile and median values. Outliers are plotted as circles. n.s.: not significant between AS subgroups.
Figure 5
Figure 5
Sugar metabolites in AS and healthy controls. (A) Illustration of glucose utilization pathways for energy production via TCA cycle including glycolysis, pentose phosphate pathway (PPP), and hexosamine biosynthetic pathway. (B) List of altered metabolites. Significantly up- and downregulated molecules are marked in red and green, respectively. Values marked in light red indicate a trend towards statistical significance (0.05 < p < 0.10). Non-colored values are not significantly different for that comparison. Numbers indicate x-fold increase/decrease in concentration. * p ≤ 0.05. (C) Glucose as an example between All-AS vs. controls as well as the different AS subgroups. (D) Pyruvate as an example between All-AS vs. controls as well as the different AS subgroups. On each box, the black cross indicates the mean value, the borders and segmentation indicate limits of upper/lower quartile and median values. Outliers are plotted as circles. n.s.: not significant between AS subgroups.
Figure 6
Figure 6
Metabolites with different serum levels between AS subgroups. (A) List of altered hemoglobin related metabolites. Bilirubin and biliverdin are illustrated as examples. (B) List of altered diacylglycerols (DAGs) in AS patients. (C) List of altered dihydrosphingomyelins (DHSMs) in AS subgroups. Myristoyl dihydrosphingomyelin is illustrated as an example. Significantly, up- and downregulated molecules are marked in red and green, respectively. Values marked in light red and light green indicate a trend towards statistical significance (0.05 < p < 0.10). Non-colored values are not significantly different for that comparison. Numbers indicate x-fold increase/decrease in concentration. On each box, the black cross indicates the mean value, the borders and segmentation indicate limits of upper/lower quartile and median values. Outliers are plotted as circles. Asterix (*) indicates p ≤ 0.05 between the annotated group and the control group.

References

    1. Baumgartner H., Falk V., Bax J.J., De Bonis M., Hamm C., Holm P.J., Iung B., Lancellotti P., Lansac E., Muñoz D.R., et al. 2017 ESC/EACTS guidelines for the management of valvular heart disease. Eur. Heart J. 2017;38:2739–2786. doi: 10.1093/eurheartj/ehx391. - DOI - PubMed
    1. Smith C.R., Leon M.B., Mack M.J., Miller D.C., Moses J.W., Svensson L.G., Tuzcu E.M., Webb J.G., Fontana G.P., Makkar R.R., et al. Transcatheter versus surgical aortic-valve replacement in high-risk patients. N. Engl. J. Med. 2011;364:2187–2198. doi: 10.1056/NEJMoa1103510. - DOI - PubMed
    1. Leon M.B., Smith C.R., Mack M.J., Makkar R.R., Svensson L.G., Kodali S.K., Thourani V.H., Tuzcu E.M., Miller D.C., Herrmann H.C., et al. Transcatheter or surgical aortic-valve replacement in intermediate-risk patients. N. Engl. J. Med. 2016;374:1609–1620. doi: 10.1056/NEJMoa1514616. - DOI - PubMed
    1. Mack M.J., Leon M.B., Thourani V.H., Makkar R., Kodali S.K., Russo M., Kapadia S.R., Chris Malaisrie S., Cohen D.J., Pibarot P., et al. Transcatheter aortic-valve replacement with a balloon-expandable valve in low-risk patients. N. Engl. J. Med. 2019;380:1695–1705. doi: 10.1056/NEJMoa1814052. - DOI - PubMed
    1. Makkar R.R., Fontana G.P., Jilaihawi H., Kapadia S., Pichard A.D., Douglas P.S., Thourani V.H., Babaliaros V.C., Webb J.G., Herrmann H.C., et al. Transcatheter aortic-valve replacement for inoperable severe aortic stenosis. N. Engl. J. Med. 2012;366:1696–1704. doi: 10.1056/NEJMoa1202277. - DOI - PubMed

Publication types