

Detection of Bacteria-Induced Early-Stage Dental Caries Using Three-Dimensional Mid-Infrared Thermophotonic Imaging
- PMID: 36671684
- PMCID: PMC9854787
- DOI: 10.3390/bioengineering10010112
Detection of Bacteria-Induced Early-Stage Dental Caries Using Three-Dimensional Mid-Infrared Thermophotonic Imaging
Abstract
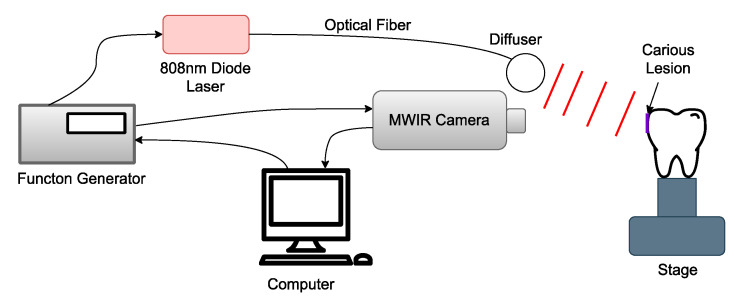
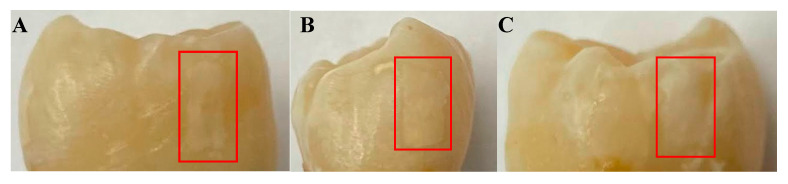
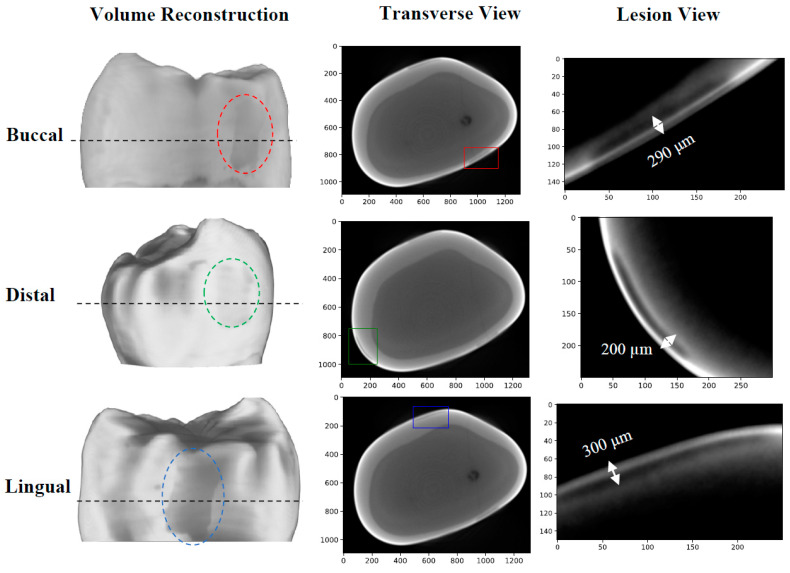
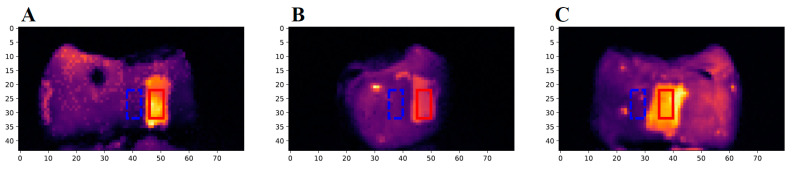
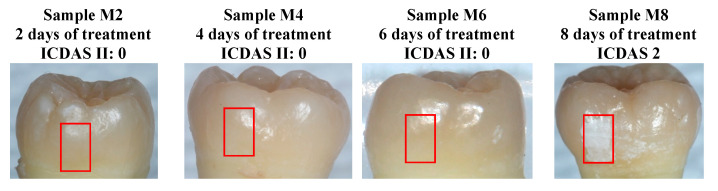
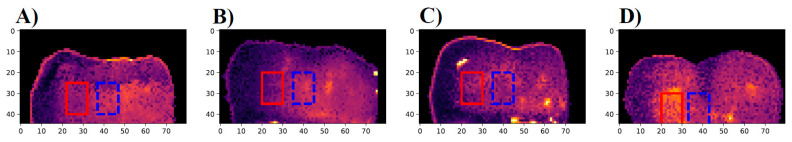
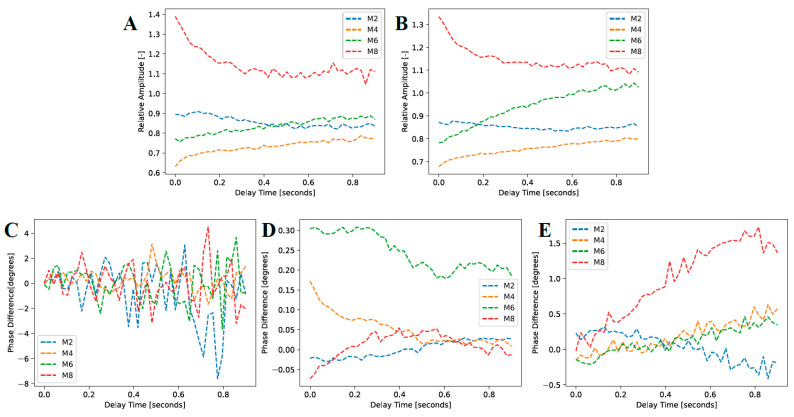
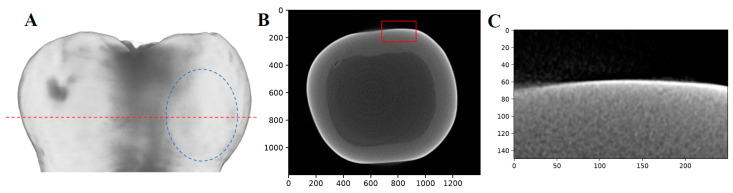
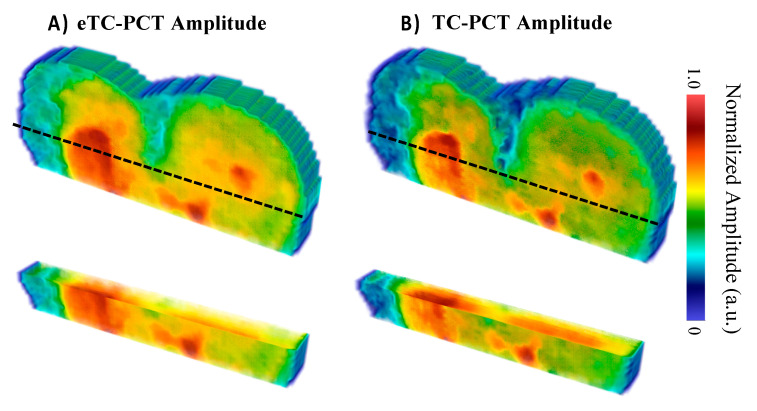
Tooth decay, or dental caries, is a widespread and costly disease that is reversible when detected early in its formation. Current dental caries diagnostic methods including X-ray imaging and intraoral examination lack the sensitivity and specificity required to routinely detect caries early in its formation. Thermophotonic imaging presents itself as a highly sensitive and non-ionizing solution, making it suitable for the frequent monitoring of caries progression. Here, we utilized a treatment protocol to produce bacteria-induced caries lesions. The lesions were imaged using two related three-dimensional photothermal imaging modalities: truncated correlation photothermal coherence tomography (TC-PCT) and its enhanced modification eTC-PCT. In addition, micro-computed tomography (μ-CT) and visual inspection by a clinical dentist were used to validate and quantify the severities of the lesions. The observational findings demonstrate the high sensitivity and depth profiling capabilities of the thermophotonic modalities, showcasing their potential use as a non-ionizing clinical tool for the early detection of dental caries.
Keywords: (enhanced) truncated correlation photothermal coherence tomography; dental caries; linear iso phase (LIOP); thermophotonic; three-dimensional imaging.
Conflict of interest statement
The authors declare no conflict of interest.
Figures
Similar articles
-
Detection and monitoring of early dental caries and erosion using three-dimensional enhanced truncated-correlation photothermal coherence tomography imaging.J Biomed Opt. 2021 Apr;26(4):046004. doi: 10.1117/1.JBO.26.4.046004. J Biomed Opt. 2021. PMID: 33928770 Free PMC article.
-
Three-dimensional thermophotonic image optimization modalities of truncated correlation photothermal coherence tomography.J Biophotonics. 2022 Jul;15(7):e202200018. doi: 10.1002/jbio.202200018. Epub 2022 Apr 6. J Biophotonics. 2022. PMID: 35293127
-
Multispectral truncated-correlation photothermal coherence tomography imaging modality for detection of early stage dental caries.Biomed Opt Express. 2022 Apr 11;13(5):2772-2781. doi: 10.1364/BOE.455117. eCollection 2022 May 1. Biomed Opt Express. 2022. PMID: 35774315 Free PMC article.
-
Imaging modalities to inform the detection and diagnosis of early caries.Cochrane Database Syst Rev. 2021 Mar 15;3(3):CD014545. doi: 10.1002/14651858.CD014545. Cochrane Database Syst Rev. 2021. PMID: 33720395 Free PMC article.
-
Alternative methods to visual and radiographic examinations for approximal caries detection.J Oral Sci. 2017 Sep 14;59(3):315-322. doi: 10.2334/josnusd.16-0595. Epub 2017 May 19. J Oral Sci. 2017. PMID: 28529280 Review.
Cited by
-
Three-dimensional thermophotonic super-resolution imaging by spatiotemporal diffusion reversal method.Sci Adv. 2023 Dec 22;9(51):eadi1899. doi: 10.1126/sciadv.adi1899. Epub 2023 Dec 22. Sci Adv. 2023. PMID: 38134277 Free PMC article.
-
Novel Approaches for the Treatment of Maxillofacial Defects.Bioengineering (Basel). 2024 Oct 2;11(10):995. doi: 10.3390/bioengineering11100995. Bioengineering (Basel). 2024. PMID: 39451371 Free PMC article.
References
-
- Klein U., Kanellis M.J., Drake D. Effects of four anticaries agents on lesion depth progression in an in vitro caries model. Pediatr. Dent. 1999;21:176–180. - PubMed
-
- National Institutes of Health Diagnosis and management of dental caries throughout life. NIH Consens. Statement. 2001;65:1162–1168. - PubMed
Grants and funding
- 381313/Canadian Institutes for Health Research (CIHR) and the Natural Sciences and Engineering Research Council (NSERC)
- 2019-00647/New Frontiers in Research Fund -Exploration
- RGPIN-2020-04595/NSERC Discovery Grants Program
- 950-230876/Canada Foundation for Innovation
- 496439-2017/Natural Sciences and Engineering Research Council
LinkOut - more resources
Full Text Sources
Research Materials
