Review
. 2022 Dec 26;13(1):27.
doi: 10.3390/bios13010027.

Raman Spectroscopy on Brain Disorders: Transition from Fundamental Research to Clinical Applications

Affiliations
Review

Raman Spectroscopy on Brain Disorders: Transition from Fundamental Research to Clinical Applications

Jeewan C Ranasinghe et al. Biosensors (Basel). .

Abstract

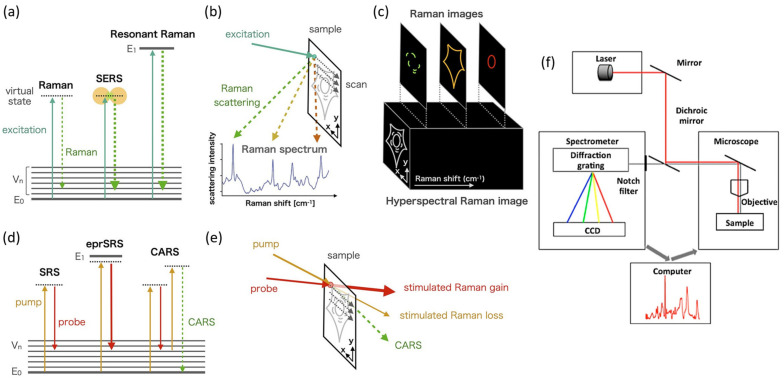
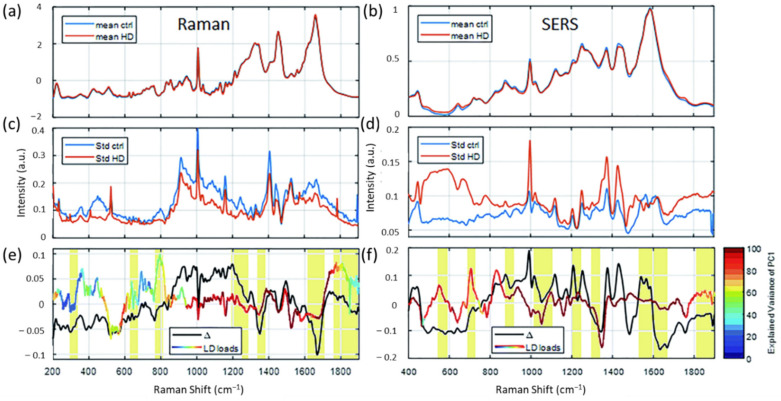
Brain disorders such as brain tumors and neurodegenerative diseases (NDs) are accompanied by chemical alterations in the tissues. Early diagnosis of these diseases will provide key benefits for patients and opportunities for preventive treatments. To detect these sophisticated diseases, various imaging modalities have been developed such as computed tomography (CT), magnetic resonance imaging (MRI), and positron emission tomography (PET). However, they provide inadequate molecule-specific information. In comparison, Raman spectroscopy (RS) is an analytical tool that provides rich information about molecular fingerprints. It is also inexpensive and rapid compared to CT, MRI, and PET. While intrinsic RS suffers from low yield, in recent years, through the adoption of Raman enhancement technologies and advanced data analysis approaches, RS has undergone significant advancements in its ability to probe biological tissues, including the brain. This review discusses recent clinical and biomedical applications of RS and related techniques applicable to brain tumors and NDs.

Keywords: Raman spectroscopy; biomarker identification; brain disorders; clinical treatment; statistical analysis.


Conflict of interest statement

The authors declare no conflict of interest.

Figures

Figure 2
Figure 2
Illustration of applicability of statistical and ML methods on RS in brain clinical applications. (a) Histogram showing the differences between groups by PCA of the Raman spectral of brain samples. Twelve-month-old wild-type mice WT (black), six-month-old transgenic mice Tg6 (blue), and twelve-month-old transgenic mice Tg12 (red). Adapted with permission from Reference [19] © 2021 The Royal Society of Chemistry. (b) Visualization of the loadings of PC7. Positive side wild-type rat (WT) and negative side transgenic rat (TG) brain samples. Adapted with permission from Reference [20] © 2021 Frontiers. (c) Raman spectra were processed by both band fitting and PCA with 50 principal components before being fed into classifiers. Adapted with permission from Reference [22] © 2019 The Royal Society of Chemistry. (d) Workflow of Raman signals’ data collection, preprocessing, and ML classification and interpretation to differentiate AD/non-AD Raman spectra of brain samples. Adapted with permission from Reference [26] © 2022 American Chemical Society. (e) Receiver operating characteristic (ROC) curve for PCA-QDA. AUC: area under the curve. AUC values between 0.7 and 0.8 are considered acceptable, between 0.8 and 0.9 are considered excellent, and above 0.9 are considered outstanding. Adapted with permission from Reference [24] © 2019 The Royal Society of Chemistry. (f) Confusion matrix for PCA-LDC model classifying: non-tumor brain tissue (N); low-grade glioma (LG); high-grade glioma (HG); meningioma (Men); metastasis (Met); lymphoma (Ly). Green is correctly classified, whereas red is incorrectly classified. Adapted with permission from Reference [28] © MDPI 2019.
Figure 3
Figure 3
Utility of Raman spectroscopic techniques in diagnosis of AD. (a) SRS images of fresh mouse brain sections at (A) 1658, (B) 1670, and (C) 1680 cm−1. (D) Three color images showing the distribution of lipids (green), proteins (blue) and amyloid plaque (pink) in the mouse brain tissue. (E) SRS spectra of the 1600–1720 cm−1 region, showing a 10 cm−1 shift of the amide I band. Adapted with permission from Reference [65] © American Association for the Advancement of Science. Overall mean spectra based on the two groups, wild-type (WT) (red) and AD mice (black), of the en face Raman measurements used for the (b) classification model and (c) the cross sections. Adapted with permission from Reference [71] © 2020 American Chemical Society. (d) SERS imaging of Aβ40 in brain tissues where (i) Bright-field of tissue slices from 2-month-old APP/PS1 transgenic mice treated with: (A) control diet, (B) Cu2+, and (C) Fe3+, Zn2+ of (D) low and (E) high concentration incubated with our SERS platform for 90 min. SERS imaging of Aβ40 in hippocampus of tissue slices: (A) control diet, (B) Cu2+, and (C) Fe3+, Zn2+ of (D) low and (E) high concentration. (ii) represents I1268 and (iii) represents I1244. (iv) SERS spectra of Aβ40 in hippocampus of tissue slices from 2-month-old APP/PS1 transgenic mice treated with: (A) control diet, (B) Cu2+, and (C) Fe3+, Zn2+ of (D) low and (E) high concentration. Adapted with permission from Reference [84] © 2020 American Chemical Society.
Figure 4
Figure 4
Applicability of different Raman techniques in diagnosis of PD. (a) Mapping of 200 SERS spectra of 1 μM alpha-synuclein solution obtained from two AgNP-coated beads trapped at 20 nm with 1 s acquisition time. The color bar shows the normalized intensities from low (dark blue) to high (red). The blue arrow represents the amide I band at around 1653 cm−1, the red arrow represents the amide I band at around 1664 cm−1, and the black arrow represents the amide I band at around 1671 cm−1. Adapted with permission from Reference [54] © 2021 Nature Portfolio. (b) Structural changes of α-synuclein during aggregation. Raman spectra (AD) reveal a narrowing of the amide I band with an increase in intensity of the peak ∼1670 cm−1, indicating an increase in β-sheet structures with aggregation. (E) ThT fluorescence spectra only show a large increase in fluorescence on filament addition, despite the high level of β-sheet detected in the protofilament sample by RS. (F) Spheroidal oligomers were observed at 21 days of incubation, with protofilaments at 32 days and filaments at 42 days of incubation. Adapted with permission from Reference [111] © 2006 Elsevier. (c) Average Raman spectra with SD of (A) ALS, (B) PD, (C) AD and (D) control groups. Adapted with permission from Reference [122] © 2020 Nature Portfolio. (d) Raman spectra of plasma dopamine extracted from the blood samples of healthy subjects and patients and (e) plasma dopamine levels of all blood plasma samples using the SERS technique. Adapted with permission from Reference [56] © 2018 Royal Society of Chemistry.
Figure 6
Figure 6
Illustration of applicability of Raman techniques in diagnosis of brain tumors. (a) Schematic showing the overall design of the experiments starting from nanoparticle preparation to intravenous infusion, surgical resection, and analyses. Adapted with permission from Reference [128] © 2019 American Chemical Society. (b) Experimental setup diagram with the 785 nm NIR laser and the high-resolution CCD spectroscopic detector used with the Raman fiber optic probe. (c) The probe (Emvision, LLC) used to interrogate brain tissue during surgery. Inset shows the excitation of different molecular species, such as cholesterol and DNA, to produce the Raman spectra of cancer versus normal brain tissue. Adapted with permission from Reference [138] © 2015 Science. (d) SERS spectra of sera from brain, breast, lung, and colorectal cancer. (e) Raman spectral profiles of serum of brain cancer patients and serum of metastasized brain cancer. Adapted with permission from Reference [129] © 2022 American Chemical Society. (f) (A) CARS image of a human U87MG glioblastoma in a mouse brain and (B) CARS image of a separate small glioblastoma island in a mouse brain. Single cell nuclei appear as dark structures in the tumor denoted by arrows. Adapted with permission from Reference [147] © 2014 Public Library of Science.
Figure 1
Figure 1
Principles of RS: (a) energy level diagram showing Raman scattering, SERS, and RRS. E0, E1, and Vn show the electronic ground state, an electronic excited state, and vibrational excited states, respectively. (b) Raman spectrum induced by laser light focused on a sample during Raman microscopy. (c) Spatial distribution of Raman spectra, also referred to as hyperspectral Raman images, where Raman images are obtained as distributions of Raman peak intensities. (d) Energy level diagram of SRS, electronic pre-resonant stimulated Raman scattering (eprSRS), and CARS. (e) SRS microscopy detects the energy exchange between the pump and probe beams via the vibrational excitation state as stimulated Raman gain (probe beam) or loss (pump beam) to reconstruct a Raman image. CARS microscopy uses CARS signals emitted from the sample as the image contrast. Adapted with permission from Reference [11] © 2021 American Chemical Society. (f) Generic setup for a Raman microspectroscopy system. Adapted with permission from Reference [12] © 2018 American Chemical Society.
Figure 5
Figure 5
Illustration of applicability of Raman techniques in diagnosis of HD. Average RS (a) and SERS (b) spectra of serum from healthy control subjects (blue lines) and HD patients (red line) as well as their standard deviations ((c,d), respectively). The different spectra of the averages for RS (black line, (e)) and SERS (black line, (f)) are within the standard deviation (c,d) of the average spectra (a,b). Yellow marked regions indicate important peaks. Adapted with permission from Reference [20] © 2020 Royal Society of Chemistry.

References

    1. Insel T.R., Cuthbert B.N. Brain disorders? Precisely. Science. 2015;348:499–500. doi: 10.1126/science.aab2358. - DOI - PubMed
    1. Fornito A., Zalesky A., Breakspear M. The connectomics of brain disorders. Nat. Rev. Neurosci. 2015;16:159–172. doi: 10.1038/nrn3901. - DOI - PubMed
    1. Kaufmann T., van der Meer D., Doan N.T., Schwarz E., Lund M.J., Agartz I., Alnæs D., Barch D.M., Baur-Streubel R., Bertolino A., et al. Common brain disorders are associated with heritable patterns of apparent aging of the brain. Nat. Neurosci. 2019;22:1617–1623. doi: 10.1038/s41593-019-0471-7. - DOI - PMC - PubMed
    1. Li D., Liu C. Conformational strains of pathogenic amyloid proteins in neurodegenerative diseases. Nat. Rev. Neurosci. 2022;23:523–534. doi: 10.1038/s41583-022-00603-7. - DOI - PubMed
    1. Myszczynska M.A., Ojamies P.N., Lacoste A., Neil D., Saffari A., Mead R., Hautbergue G.M., Holbrook J.D., Ferraiuolo L. Applications of machine learning to diagnosis and treatment of neurodegenerative diseases. Nat. Rev. Neurol. 2020;16:440–456. doi: 10.1038/s41582-020-0377-8. - DOI - PubMed

MeSH terms