

Dual-Emission Carbon-Dot Ratiometric Fluorescence Sensor for Morphine Recognition in Biological Samples
- PMID: 36671978
- PMCID: PMC9856496
- DOI: 10.3390/bios13010143
Dual-Emission Carbon-Dot Ratiometric Fluorescence Sensor for Morphine Recognition in Biological Samples
Abstract
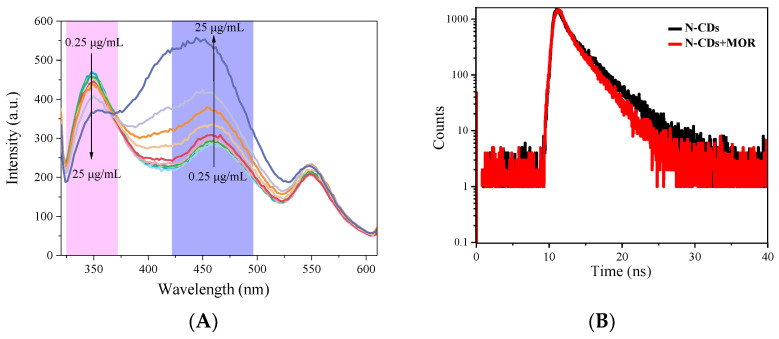
Herein, a novel nitr[ogen-doped carbon dot (N-CD) fluorescence sensor with a dual emission ratio is developed using the microwave-assisted synthesis of m-phenylenediamine and spermidine. As a result of the fluorescence inner filtration effect (IFE) effect between morphine (MOR) and N-CD, the blue fluorescence of N-CDs at 350 nm was reduced in the presence of MOR, whereas the fluorescence of N-CDs at 456 nm increased substantially. The results demonstrated that the approach has a tremendous potential and that the linear range of MOR detection is 0.25-25 µg/mL, with a 71.8 ng/mL detection limit. Under UV light, the blue fluorescent system is easily visible to the naked eye. More significantly, the sensor proved successful in providing satisfactory results for the speciation measurement of MOR in a variety of biological samples.
Keywords: carbon dots; dual-emission; fluorescent sensor; morphine.
Conflict of interest statement
The authors declare no conflict of interest.
Figures


References
-
- Acharya H.S., Sharma V. Molecular characterization of opium poppy (Papaver somniferum) germplasm. Am. J. Infect. Dis. 2009;5:148–153. doi: 10.3844/ajidsp.2009.148.153. - DOI
-
- Pandey S.S., Singh S., Babu C.S.V., Shanker K., Srivastava N.K., Shukla A.K., Kalra A. Fungal endophytes of catharanthus roseus enhance vindoline content by modulating structural and regulatory genes related to terpenoid indole alkaloid biosynthesis. Sci. Rep. 2016;6:26583. doi: 10.1038/srep26583. - DOI - PMC - PubMed
-
- Celik I., Camci H., Kose A., Kosar F.C., Doganlar S., Frary A. Molecular genetic diversity and association mapping of morphine content and agronomic traits in turkish opium poppy (papaver somniferum) germplasm. Mol. Breed. 2016;36:46. doi: 10.1007/s11032-016-0469-8. - DOI
-
- Brezinová B., Macák M., Eftimová J. The morphological diversity of selected traits of world collection of poppy genotypes (genus Papaver) J. Cent. Eur. Agric. 2009;10:183–192.
-
- Bandoni A.L., Stermitz F.R., Rondina R., Coussio J.D. Alkaloidal content of argentine argemone. Phytochemistry. 1975;14:1785–1788. doi: 10.1016/0031-9422(75)85294-0. - DOI
MeSH terms
Substances
LinkOut - more resources
Full Text Sources
Research Materials
