. 2023 Jan 3;13(1):93.
doi: 10.3390/brainsci13010093.

Decreased Brain Structural Network Connectivity in Patients with Mild Cognitive Impairment: A Novel Fractal Dimension Analysis

Affiliations

Decreased Brain Structural Network Connectivity in Patients with Mild Cognitive Impairment: A Novel Fractal Dimension Analysis

Chi Ieong Lau et al. Brain Sci. .

Abstract

Mild cognitive impairment (MCI) is widely regarded to be the intermediate stage to Alzheimer's disease. Cerebral morphological alteration in cortical subregions can provide an accurate predictor for early recognition of MCI. Thirty patients with MCI and thirty healthy control subjects participated in this study. The Desikan-Killiany cortical atlas was applied to segment participants' cerebral cortex into 68 subregions. A complexity measure termed fractal dimension (FD) was applied to assess morphological changes in cortical subregions of participants. The MCI group revealed significantly decreased FD values in the bilateral temporal lobes, right parietal lobe including the medial temporal, fusiform, para hippocampal, and also the orbitofrontal lobes. We further proposed a novel FD-based brain structural network to compare network parameters, including intra- and inter-lobular connectivity between groups. The control group had five modules, and the MCI group had six modules in their brain networks. The MCI group demonstrated shrinkage of modular sizes with fewer components integrated, and significantly decreased global modularity in the brain network. The MCI group had lower intra- and inter-lobular connectivity in all lobes. Between cerebral lobes, the MCI patients may maintain nodal connections between both hemispheres to reduce connectivity loss in the lateral hemispheres. The method and results presented in this study could be a suitable tool for early detection of MCI.

Keywords: Alzheimer’s disease; MCI; brain structural network; cognitive function; fractal dimension.


Conflict of interest statement

The authors declare that there are no any conflict of interest.

Figures

Figure 1
Figure 1
FD measure estimation. Log-log scatter plot, where the x and y axis denote the inverse of the box size and the number of boxes in the logarithmic scale, respectively. The FD value is the slope of the fitting line.
Figure 2
Figure 2
Subregion correlation maps between different brain lobes: (a) in the control group and (b) in the MCI group. There are 68 rows and 68 columns in each plot, and the dots from the first row and first column from the top left indicate the correlation rate of the first subregion of the ROI (left anterior cingulate) with the other 67 subregions, the second row and second column from the top left indicate the correlation rate of the second subregion of the ROI (right anterior cingulate) with the other 67 subregions, and so on. In each figure, subregions of the frontal lobe are labeled within the red line, the temporal lobe is labeled within the purple line, the parietal lobe is labeled within the white line, and the occipital lobe is labeled within the green line. The color bars indicate the density of correlation, and the color bars of the control group are scaled higher than those of the MCI group. For each brain lobe, normal control participants showed higher correlation densities within the lobes and with other lobes than the MCI group.
Figure 3
Figure 3
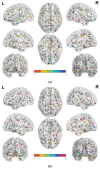
The node distribution of modules in the FD-based brain structural network for the control and MCI groups.(a) The distribution of cerebral subregions in each modules of control participants group; (b) the distribution of cerebral subregions in each modules of brain structural network of patients with MCI. In each subfigure, red dots demonstrate the nodes of Module 1, yellow dots for Module 2, green dots for Module 3, turquoise dots for Module 4, and royal blue dots for module 5.
Figure 4
Figure 4
Intra-modular connectivity of each lobe in the control group and MCI group. Control group: (a) frontal lobe; (b) temporal lobe; (c) parietal lobe; (d) occipital lobe. MCI group: (e) frontal lobe; (f) temporal lobe; (g) parietal lobe; (h) occipital lobe. In each figure, the blue lines depict the lateral links within the left cerebral hemisphere, while the green lines depict the lateral links within the right cerebral hemisphere. The red lines depict the bilateral links between left and right hemispheres. In each figure, the wider line implies a stronger connecting strength, and the thinner line implies a lower connecting strength.
Figure 5
Figure 5
Long lateral hemisphere connections and bilateral hemisphere connections between lobes of the control and MCI groups: (a) Control group long lateral hemisphere connections; (b) MCI group long lateral hemisphere connections; (c) control group bilateral hemispheres connections; (d) MCI group bilateral hemispheres connections. In each figure, the left half depicts the left hemisphere, while the right half depicts the right hemisphere. In each hemisphere, there are four lobes, labeled frontal, temporal, parietal, and occipital. Each ROI of the frontal lobe is labeled with a blue circle and abbreviation, the temporal lobe is indicated with a green circle, the parietal lobe with a red circle, and the occipital lobe is illustrated with a green-blue circle. As revealed in the intra-lobular connectivity analysis, the width of the connecting lines in each figure indicates the strength of the connectivity coefficient between nodes, with wider lines implying higher connectivity between nodes. In Figure 5, we use the color of the lines to indicate the different connecting links between the brain lobes. Blue lines indicate links from frontal to temporal lobes, frontal to parietal connections are represented by yellow-green lines, and links from frontal to orbital lobes are represented by red lines. Yellow lines indicate links from the temporal lobe to the occipital lobe, connections between the temporal and parietal lobes are represented by mossy green lines, and purple lines indicate connections between the occipital and parietal lobes.
Figure 5
Figure 5
Long lateral hemisphere connections and bilateral hemisphere connections between lobes of the control and MCI groups: (a) Control group long lateral hemisphere connections; (b) MCI group long lateral hemisphere connections; (c) control group bilateral hemispheres connections; (d) MCI group bilateral hemispheres connections. In each figure, the left half depicts the left hemisphere, while the right half depicts the right hemisphere. In each hemisphere, there are four lobes, labeled frontal, temporal, parietal, and occipital. Each ROI of the frontal lobe is labeled with a blue circle and abbreviation, the temporal lobe is indicated with a green circle, the parietal lobe with a red circle, and the occipital lobe is illustrated with a green-blue circle. As revealed in the intra-lobular connectivity analysis, the width of the connecting lines in each figure indicates the strength of the connectivity coefficient between nodes, with wider lines implying higher connectivity between nodes. In Figure 5, we use the color of the lines to indicate the different connecting links between the brain lobes. Blue lines indicate links from frontal to temporal lobes, frontal to parietal connections are represented by yellow-green lines, and links from frontal to orbital lobes are represented by red lines. Yellow lines indicate links from the temporal lobe to the occipital lobe, connections between the temporal and parietal lobes are represented by mossy green lines, and purple lines indicate connections between the occipital and parietal lobes.

Similar articles

References

    1. Vega J.N., Newhouse P.A. Mild cognitive impairment: Diagnosis, longitudinal course, and emerging treatments. Curr. Psychiatry Rep. 2014;16:490. doi: 10.1007/s11920-014-0490-8. - DOI - PMC - PubMed
    1. Tabatabaei-Jafari H., Shaw M.E., Cherbuin N. Cerebral atrophy in mild cognitive impairment: A systematic review with meta-analysis. Alzheimers Dement. 2015;1:487–504. doi: 10.1016/j.dadm.2015.11.002. - DOI - PMC - PubMed
    1. Roberts R., Knopman D.S. Classification and epidemiology of MCI. Clin. Geriatr. Med. 2013;29:753–772. doi: 10.1016/j.cger.2013.07.003. - DOI - PMC - PubMed
    1. Petersen R.C. Mild Cognitive Impairment. Continuum (Minneap. Minn.) 2016;22:404–418. doi: 10.1212/CON.0000000000000313. - DOI - PMC - PubMed
    1. Singh V., Chertkow H., Lerch J.P., Evans A.C., Dorr A.E., Kabani N.J. Spatial patterns of cortical thinning in mild cognitive impairment and Alzheimer’s disease. Brain. 2006;129:2885–2893. doi: 10.1093/brain/awl256. - DOI - PubMed

LinkOut - more resources