. 2023 Jan 4;12(2):218.
doi: 10.3390/cells12020218.

Optimization of 3D Immunofluorescence Analysis and Visualization Using IMARIS and MeshLab

Affiliations

Optimization of 3D Immunofluorescence Analysis and Visualization Using IMARIS and MeshLab

Zulzikry Hafiz Abu Bakar et al. Cells. .

Abstract

The precision of colocalization analysis is enhanced by 3D and is potentially more accurate than 2D. Even though 3D improves the visualization of colocalization analysis, rendering a colocalization model may generate a model with numerous polygons. We developed a 3D colocalization model of FtMt/LC3 followed by simplification. Double immunofluorescence staining of FtMt and LC3 was conducted, and stacked images were acquired. We used IMARIS to render the 3D colocalization model of FtMt/LC3 and further processed it with MeshLab to decimate and generate a less complex colocalization model. We examined the available simplification algorithm using MeshLab in detail and evaluated the feasibility of each procedure in generating a model with less complexity. The quality of the simplified model was subsequently assessed. MeshLab's available shaders were scrutinized to facilitate the spatial colocalization determination. Finally, we showed that QECD was the most effective method for reducing the polygonal complexity of the colocalization model without compromising its quality. In addition, we would recommend implementing the x-ray shader, which we found useful for visualizing colocalization. As 3D was found to be more accurate in quantifying colocalization, our study provides a novel and dependable method for rendering 3D models for colocalization analysis.

Keywords: 3D; IMARIS; MeshLab; colocalization analysis; decimation; simplification.


Conflict of interest statement

The authors declare no conflict of interest.

Figures

Figure 1
Figure 1
FtMt and LC3 immunoreactivity and merged images of the two immunoreactive signals. (A,C,E). Confocal images of FtMt, LC3, and merged signals of both immunoreactivities. There was an obvious colocalization between FtMt and LC3 immunoreactivity. (B,D,F). High-magnification image of the boxed area in (A), (C), and (E), respectively. Drawn ellipses surrounding the neuron were the acquired size for rendering a 3D model. Nuclei stained with Hoechst 33258 are shown in the merged images. Panels (F) contain an additional inset with vivid nuclei staining to illustrate the boundaries of the cell nucleus (magnification is the same as the main panel). All scale bars: 20 µm.
Figure 2
Figure 2
Number of faces and vertices of FtMt and LC3 3D models before and after the simplification procedure. (A). Number of faces of FtMt 3D models before and after 25%, 50%, and 75% simplification through CD and QECD. There was a significant decrease in the number of faces undergoing CD at 50% and 75% simplification compared to QECD. (B). Number of faces of LC3 3D models before and after 25%, 50%, and 75% simplification through CD and QECD. There was no significant difference in the number of faces undergoing CD at 25%, 50% and 75% simplification compared to QECD. (C). Number of vertices of FtMt 3D models before and after 25%, 50%, and 75% simplification through CD and QECD. There was a significant decrease in the number of faces undergoing CD at 50% and 75% simplification compared to QECD. (D). Number of vertices of LC3 3D models before and after 25%, 50%, and 75% simplification through CD and QECD. There was no significant difference in the number of vertices undergoing CD at 25%, 50%, and 75% simplification compared to QECD. 0% indicate the original number of faces and vertices, respectively. * demonstrates a statistically significant difference (p < 0.05) between CD and QECD at a particular simplification percentage. Data are presented as the mean ± standard deviation (SD).
Figure 3
Figure 3
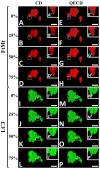
The shape of the FtMt and LC3 3D models before and after the simplification procedure. (AH). The shape of the FtMt model at 0%, 25%, 50%, and 75% of CD and QECD simplification, respectively. (A’H’). High-magnification image of the boxed area in (AH), respectively. There was no notable change in the shape after undergoing 25% simplification through the CD and QECD. However, the shape was slightly changed with CD at 50% and 75% simplification. On the other hand, there was no noticeable change in the shape with QECD at 50% and 75% simplification. (IP). The shape of the LC3 model at 0%, 25%, 50%, and 75% of CD and QECD simplification, respectively. (I’P’). High-magnification image of the boxed area in (IP), respectively. There was no notable change in the shape after undergoing 25% simplification through the CD and QECD. However, the shape was slightly altered with CD at 50% and 75% simplification. On the other hand, the shape did not change significantly with QECD at 50% and 75% simplification. All scale bars: 0.5 µm.
Figure 4
Figure 4
The surface area and volume of FtMt and LC3 3D models before and after simplification. (A,B). Surface area of FtMt and LC3 3D models before and after 25%, 50%, and 75% simplification through CD and QECD, respectively. There were no significant changes in the surface area of the FtMt model at 25% simplification through CD compared to the original model. However, there were significant changes in the volume of the model at 50% and 75% simplification compared to the initial volume of the FtMt and LC3 models, respectively. (C,D). Volume of the FtMt and LC3 3D models before and following 25%, 50%, and 75% simplification by CD and QECD, respectively. Comparing the FtMt model with a 25% simplification through CD to the original model, there were no significant changes in surface area. Nonetheless, the volume of the model at 50% and 75% simplification differed significantly from the initial volume of the FtMt and LC3 models, respectively. 0% indicates the original number of faces and vertices, respectively. * indicates a significant difference (p < 0.05) at 50% simplification compared to the initial rendered model (0%). ** indicates a significant difference (p < 0.05) at 75% simplification compared to the initial rendered model (0%). Data are presented as the mean ± standard deviation (SD).
Figure 5
Figure 5
The FtMt and LC3 colocalization model is rendered using a shader. (A). Colocalization model before administrating the shader. Colocalized region was not visible as it was obstructed by the respective rendered FtMt and LC3 3D model. (B). Top view of FtMt and LC3 colocalization model without application of shader. FtMt signal was presented as a network/mesh while LC3 signal was presented as a solid surface. (C). Top view of FtMt and LC3 colocalization model with shader applied. Colocalization region between FtMt and LC3 signal was visible within the model. (D). Side view of FtMt and LC3 colocalization model. FtMt signal was presented as a network/mesh while LC3 signal was presented as a solid surface. (E). Side view of FtMt and LC3 colocalization model without application of shader. FtMt signal was presented as a network/mesh while LC3 signal was presented as a solid surface. Colocalization region between FtMt and LC3 signal was visible within the model.
Figure 6
Figure 6
Illustration of a model that underwent vertex clustering and edge collapse simplification. Although both approaches produce fewer vertices than the initial model, clustering decimation was likely to introduce changes to the model’s shape. Whereas the model underwent edge collapse, simplification appeared to retain its shape.

References

    1. Zinchuk V., Grossenbacher-Zinchuk O. Recent advances in quantitative colocalization analysis: Focus on neuroscience. Prog. Histochem. Cytochem. 2009;44:125–172. doi: 10.1016/j.proghi.2009.03.001. - DOI - PubMed
    1. Zinchuk V., Zinchuk O., Okada T. Quantitative colocalization analysis of multicolor confocal immunofluorescence microscopy images: Pushing pixels to explore biological phenomena. Acta Histochem. Cytochem. 2007;40:101–111. doi: 10.1267/ahc.07002. - DOI - PMC - PubMed
    1. Costes S.V., Daelemans D., Cho E.H., Dobbin Z., Pavlakis G., Lockett S. Automatic and quantitative measurement of protein-protein colocalization in live cells. Biophys. J. 2004;86:3993–4003. doi: 10.1529/biophysj.103.038422. - DOI - PMC - PubMed
    1. Angénieux C., Fraisier V., Maître B., Racine V., van der Wel N., Fricker D., Proamer F., Sachse M., Cazenave J.P., Peters P. The cellular pathway of CD1e in immature and maturing dendritic cells. Traffic. 2005;6:286–302. doi: 10.1111/j.1600-0854.2005.00272.x. - DOI - PubMed
    1. Abu Bakar Z.H., Bellier J.-P., Yanagisawa D., Kato T., Mukaisho K.-i., Tooyama I. LC3/FtMt colocalization patterns reveal the progression of FtMt accumulation in nigral neurons of patients with progressive supranuclear palsy. Int. J. Mol. Sci. 2022;23:537. doi: 10.3390/ijms23010537. - DOI - PMC - PubMed

Publication types

MeSH terms