. 2023 Jan 12;12(2):297.
doi: 10.3390/cells12020297.

Etiological Roles of p75NTR in a Mouse Model of Wet Age-Related Macular Degeneration

Affiliations

Etiological Roles of p75NTR in a Mouse Model of Wet Age-Related Macular Degeneration

Paula Virginia Subirada et al. Cells. .

Abstract

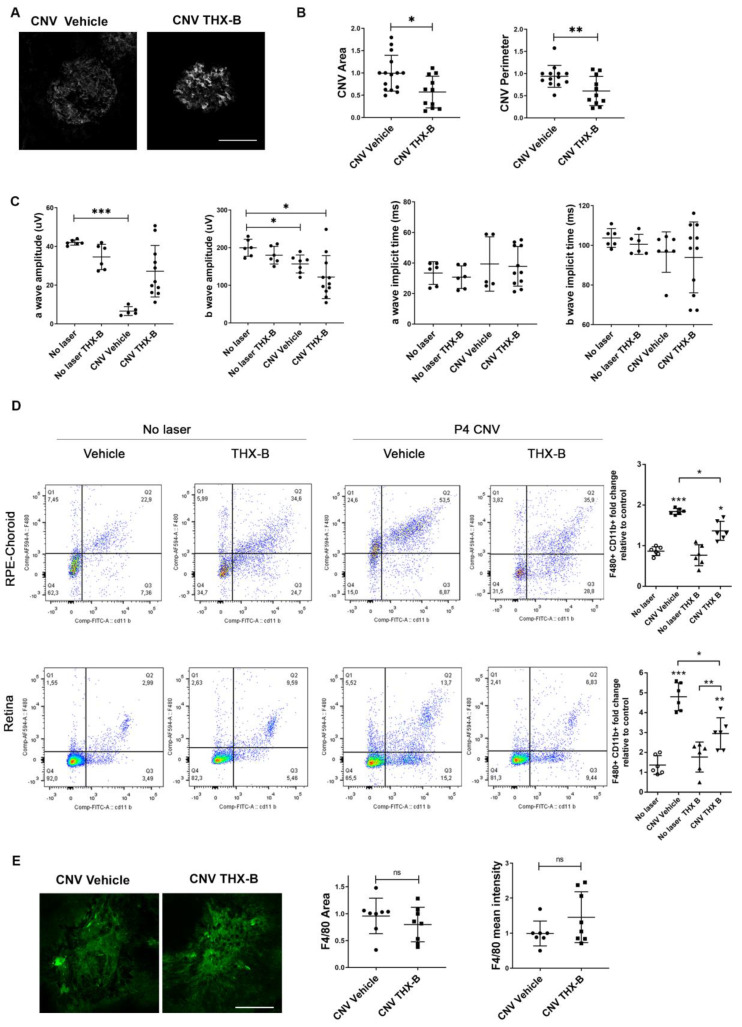
Choroidal neovascularization (CNV) is a pathological angiogenesis of the choroidal plexus of the retina and is a key feature in the wet form of age-related macular degeneration. Mononuclear phagocytic cells (MPCs) are known to accumulate in the subretinal space, generating a chronic inflammatory state that promotes the growth of the choroidal neovasculature. However, how the MPCs are recruited and activated to promote CNV pathology is not fully understood. Using genetic and pharmacological tools in a mouse model of laser-induced CNV, we demonstrate a role for the p75 neurotrophin receptor (p75NTR) in the recruitment of MPCs, in glial activation, and in vascular alterations. After laser injury, expression of p75NTR is increased in activated Muller glial cells near the CNV area in the retina and the retinal pigmented epithelium (RPE)-choroid. In p75NTR knockout mice (p75NTR KO) with CNV, there is significantly reduced recruitment of MPCs, reduced glial activation, reduced CNV area, and the retinal function is preserved, as compared to wild type mice with CNV. Notably, a single intravitreal injection of a pharmacological p75NTR antagonist in wild type mice with CNV phenocopied the results of the p75NTR KO mice. Our results demonstrate that p75NTR is etiological in the development of CNV.

Keywords: choroidal neovascularization; mononuclear phagocytic cells; neurodegeneration; p75NTR; wet age-related macular degeneration.


Conflict of interest statement

The authors declare that the research was conducted in the absence of any commercial or financial relationships that could be construed as a potential conflict of interest.

Figures

Figure 1
Figure 1
MPCs expressing p75NTR migrate into the laser-injured area of RPE-Choroid. p75NTR co-localizes in F4/80 positive cells in RPE-Choroid. Tissue extracts and flat-mounted retinas were prepared and evaluated by Western blot and by IHC. (A) Representative Western blot of RPE-Choroid homogenates prepared from WT mice without CNV, or 4 days after laser injury. Tubulin was used as loading control. Bands were quantified by densitometric analysis, and p75NTR/tubulin ratio is represented in the bar graph expressed as units relative to control. Bars denote the mean ± SD from triplicate experiments, n = 5 mice/group. The asterisks show statistical differences respect to control. * p < 0.05. (B) Representative Western blot of RPE-Choroid homogenates prepared from WT mice without CNV, or 7 days after laser injury. Tubulin was used as loading control. Bands were quantified by densitometric analysis, and p75NTR/tubulin ratio is represented in the bar graph expressed as units relative to control. ns: non-significant. Bars denote the mean ± SD from triplicate experiments, n = at least 4 mice/group. (CE) Representative confocal images of RPE-Choroid flat-mounts of WT mice 4 days after laser injury, showing immunofluorescence staining with: (C) F4/80 (green), p75NTR (red) and cell nuclei (blue). Scale bar upper panel: 50 µm. Scale bar lower panel: 20 µm. (D) IBA-1 (green), p75NTR (red) and cell nuclei (blue). Scale bar upper panel: 100 µm. Scale bar lower panel: 50 µm. (E) CX3CR1 (green), p75NTR (red) and cell nuclei (blue). Scale bar upper panel: 100 µm. Scale bar lower panel: 25 µm. (F,G) Representative confocal images of RPE-Choroid flat-mounts of WT mice 7 days after laser injury, showing immunofluorescence staining with (F) Isolectin IB-4 (green), p75NTR (red) and cell nuclei (blue). Scale bar: 50 µm. (G) NG-2 (green), p75NTR (red) and cell nuclei (blue). Scale bar: 50 µm.
Figure 2
Figure 2
Activated macroglial cells express p75NTR after the laser around the injured area in the retina. p75NTR protein co-localizes with GFAP-positive activated macroglia in CNV mice retinas, 7 days after laser. Tissue extracts and retina sections were prepared and evaluated by Western blot and by IHC. (A) Representative Western blot of total retinas homogenates prepared from WT mice without CNV, or 7 days after laser injury. (+) Correspond to a positive control (hippocampus E19 M2). Actin was used as loading control. Bands were quantified by densitometric analysis, and p75NTR/actin ratio is represented in the bar graph expressed as units relative to control. Bars denote the mean ± SD from triplicate experiments, n = 6 mice/group. The asterisks show statistical differences respect to control. * p < 0.05. (B) Representative confocal images of WT CNV mice retinal cryosections, 7 days after laser. Upper panel: immunofluorescence staining of GFAP (green) and p75NTR (red). Scale bar: 50 µm. * Indicates the injured area. Zoom scale bar: 25 µm. Cell nuclei counterstained with Hoechst are also shown (blue). Lower panel: immunofluorescence staining of β3 tubulin (green) and p75NTR (red). Scale bar: 25 µm. Zoom scale bar: 10 µm. Abbreviations: GCL (ganglion cells layer), IPL (inner plexiform layer), INL (inner nuclear layer), OPL (outer plexiform layer), ONL (outer nuclear layer). (C) Representative confocal images of retinal flat-mount of WT CNV mice, 7 days after laser, showing immunofluorescence staining with NG-2 (green) and p75NTR (red). Scale bar: 50 µm.
Figure 3
Figure 3
Reduced inflammatory phenotype in the RPE-Choroids and retinas of p75NTR knockout mice, after laser injury. Mononuclear phagocytic cell recruitment is significantly reduced in retinas and RPE-Choroids of p75NTRKO mice after CNV. (A) Representative flow cytometry pseudocolor plots from WT and p75NTRKO mice without CNV, or 4 days after laser injury. Cells in the gate were quantified and the number of cells in the gate/total cells ratio is represented in the bar graph expressed as units relative to WT no laser control. Graphs denote the mean ± SD from triplicate experiments, n = 6 mice/group. The asterisks show statistical differences respect to control. * p < 0.05, ** p < 0.01, *** p < 0.001. (B) Representative confocal images of RPE-Choroid flat-mounts of WT and p75NTRKO mice 4 days after laser, showing immunofluorescence staining with Isolectin IB-4 (grey) and F4/80 (green). Scale bar: 200 µm. F4/80 fluorescence intensity and area were quantified with ImageJ FIJI software Version 1.53t, and represented in the bar graph expressed as units relative to CNV WT control. Bars denote the mean ± SD from triplicate experiments, n = at least 5 mice/group. ns: non-significant.
Figure 4
Figure 4
Reduced neovascular phenotype in the choroid of p75NTR knockout mice, after laser injury. The area and the perimeter of choroidal neovessels are significantly reduced in RPE-Choroid flat-mounts of p75NTR KO mice. (A) Representative confocal images of RPE-Choroid flat-mounts of WT and p75NTR KO mice 1 day after laser injury, showing immunofluorescence staining with Falloidin (green). The yellow outline represents the lesioned area estimated by F-actin negative staining. Scale bar: 15 µm. Cell nuclei counterstained with Hoechst are also shown (blue). The area and perimeter of the laser lesion were quantified with ImageJ FIJI software, and represented in the bar graph expressed as units relative to WT CNV control. Bars denote the mean ± SD from triplicate experiments, n = 4 mice/group. ns: non-significant. (B) Representative confocal images of RPE-Choroid flat-mounts of WT mice 7 days after laser injury, showing immunofluorescence staining with Isolectin IB-4 (green). The yellow outline represents the neovessels covered area. Scale bar: 200 µm. The area and the perimeter of the neovessels were quantified with ImageJ FIJI software, and represented in the bar graph expressed as units relative to CNV WT control. Bars denote the mean ± SD from triplicate experiments, n = at least 6 mice/group. The asterisks show statistical differences respect to control. * p < 0.05, ** p < 0.01, *** p < 0.001. (C) Representative Western blot of total retinal homogenates prepared from WT and p75NTRKO mice without CNV, or 7 days after laser injury. Tubulin was used as loading control. Bands were quantified by densitometric analysis, and GFAP/tubulin ratio is represented in the bar graph expressed as units relative to control. Bars denote the mean ± SD from triplicate experiments, n = 3 mice/group. (D) Representative immunofluorescence analysis of GFAP (green) in retinal cryosections from WT and p75NTRKO mice without injury or 7 days after laser injury. Scale bar: 50 µm. Cell nuclei counterstained with Hoechst are also shown (blue). Abbreviations: GCL (ganglion cells layer), IPL (inner plexiform layer), INL (inner nuclear layer), OPL (outer plexiform layer), ONL (outer nuclear layer). (E) Amplitudes and implicit times of a- and b-waves from scotopic electroretinograms recorded in WT and p75NTRKO mice without injury or 7 days after laser injury. The data show averages of responses of both eyes. Graphs denote the mean ± SD from triplicate experiments, n = at least 6 mice/group. The symbol correspond: WT no laser (filled circle), WT CNV (filled square), p75NTRKO no laser (filled triangle up), p75NTRKO CNV (filled triangle down). The asterisks show statistical differences respect to control. * p < 0.05, ** p < 0.01, *** p < 0.001.
Figure 5
Figure 5
Reduced neovascular phenotype and improved retinal function in p75NTR antagonist-treated wild type mice after laser injury. p75NTR receptor antagonist reduced the area and perimeter of choroidal neovessels and improved retinal functionality in WT CNV mice. (A) Representative confocal images of RPE-Choroid flat-mounts of WT mice 7 days after laser, showing immunofluorescence staining with Isolectin IB-4 (grey). Scale bar: 100 µm. (B) The area and perimeter of neovessels were quantified with ImageJ FIJI software and represented in the bar graph expressed as units relative to WT CNV vehicle control. Bars denote the mean ± SD from triplicate experiments, n = 5 mice/group. (C) Amplitudes and implicit times of a- and b-waves from scotopic electroretinograms recorded 7 days after the laser in WT and WT CNV mice injected with THX-B or vehicle. The data show averages of responses of both. Graphs denote the mean ± SD from triplicate experiments, n = at least 6 mice/group. (D) Representative flow cytometry pseudocolor plots from WT CNV and no laser mice injected with THX-B or vehicle, 4 days after laser. Cells in the gate were quantified and the number of cells in the gate/total cells ratio is represented in the bar graph expressed as units relative to WT no laser vehicle control. Graphs denote the mean ± SD from triplicate experiments, n = 6 mice/group. The symbol correspond: No laser (white circle), CNV Vehicle (filled square), No laser THX B (filled triangle up), CNV THX B (filled triangle down). The asterisks show statistical differences respect to control. * p < 0.05, ** p < 0.01, *** p < 0.001. (E) Representative confocal images of RPE-Choroid flat-mounts of WT mice 4 days after laser, showing immunofluorescence staining with F4/80 (green). Scale bar: 200 µm. The area and the F4/80 fluorescence intensity were quantified with ImageJ FIJI software and represented in the bar graph expressed as units relative to WT CNV+ vehicle control. Bars denote the mean ± SD from triplicate experiments, n = 4 mice/group. ns: non-significant.

Similar articles

References

    1. Wong W.L., Su X., Li X., Cheung C.M., Klein R., Cheng C.Y., Wong T.Y. Global prevalence of age-related macular degeneration and disease burden projection for 2020 and 2040: A systematic review and meta-analysis. Lancet Glob. Health. 2014;2:e106–e116. doi: 10.1016/S2214-109X(13)70145-1. - DOI - PubMed
    1. Armstrong R.A., Mousavi M. Overview of Risk Factors for Age-Related Macular Degeneration (AMD) J. Stem Cells. 2015;10:171–191. - PubMed
    1. Bhutto I., Lutty G. Understanding age-related macular degeneration (AMD): Relationships between the photoreceptor/retinal pigment epithelium/Bruch’s membrane/choriocapillaris complex. Mol. Asp. Med. 2012;33:295–317. doi: 10.1016/j.mam.2012.04.005. - DOI - PMC - PubMed
    1. van Lookeren Campagne M., LeCouter J., Yaspan B.L., Ye W. Mechanisms of age-related macular degeneration and therapeutic opportunities. J. Pathol. 2014;232:151–164. doi: 10.1002/path.4266. - DOI - PubMed
    1. Karlen S.J., Miller E.B., Burns M.E. Microglia Activation and Inflammation During the Death of Mammalian Photoreceptors. Annu. Rev. Vis. Sci. 2020;6:149–169. doi: 10.1146/annurev-vision-121219-081730. - DOI - PMC - PubMed

Publication types

Substances

LinkOut - more resources