. 2023 Jan 13;12(2):313.
doi: 10.3390/cells12020313.

Triphasic 3D In Vitro Model of Bone-Tendon-Muscle Interfaces to Study Their Regeneration

Affiliations

Triphasic 3D In Vitro Model of Bone-Tendon-Muscle Interfaces to Study Their Regeneration

Wendy Balestri et al. Cells. .

Abstract

The transition areas between different tissues, known as tissue interfaces, have limited ability to regenerate after damage, which can lead to incomplete healing. Previous studies focussed on single interfaces, most commonly bone-tendon and bone-cartilage interfaces. Herein, we develop a 3D in vitro model to study the regeneration of the bone-tendon-muscle interface. The 3D model was prepared from collagen and agarose, with different concentrations of hydroxyapatite to graduate the tissues from bones to muscles, resulting in a stiffness gradient. This graduated structure was fabricated using indirect 3D printing to provide biologically relevant surface topographies. MG-63, human dermal fibroblasts, and Sket.4U cells were found suitable cell models for bones, tendons, and muscles, respectively. The biphasic and triphasic hydrogels composing the 3D model were shown to be suitable for cell growth. Cells were co-cultured on the 3D model for over 21 days before assessing cell proliferation, metabolic activity, viability, cytotoxicity, tissue-specific markers, and matrix deposition to determine interface formations. The studies were conducted in a newly developed growth chamber that allowed cell communication while the cell culture media was compartmentalised. The 3D model promoted cell viability, tissue-specific marker expression, and new matrix deposition over 21 days, thereby showing promise for the development of new interfaces.

Keywords: 3D cell culture; co-culture; composite hydrogels; indirect 3D printing; regenerative medicine; stiffness gradient; tissue interfaces.


Conflict of interest statement

The authors declare no conflict of interest.

Figures

Figure 1
Figure 1
CAD model of the 3D in vitro interface model and vertical mould (A) The 3D model was designed with Autodesk fusion 360 with pores (bone section) and ridges (tendon, muscle sections). (B) A vertical mould for fabricating the 3D in vitro model was made of a base (1), a support with the negative shape of the surface topography (2), a body to provide the main rectangular shape of the model (3), and a lid to prevent bacterial contamination (4).
Figure 2
Figure 2
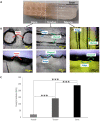
Surface topography and the Young’s moduli of the 3D in vitro model. (A) The 3D in vitro model was made of three sections made of 3 mg/mL type I collagen, 0.75% (w/v) agarose, and a gradient of hydroxyapatite decreasing from the bone to the muscle sections. (B) Top and lateral views of the pores on the bone section; the ridges and channels of the tendon and muscle sections. Scale bar = 5 mm and 200 µm. (C) The compression test was performed with 1N load of cells. The Young’s modulus was determined from stress vs strain curves. A stiffness gradient was obtained with an increase in the Young’s modulus from the muscle to bone hydrogels. One-way ANOVA and the Tukey post hoc test were performed, *** = p < 0.001. Error bars show standard deviation (muscle n = 7; tendon: n = 6; bone: n = 5).
Figure 3
Figure 3
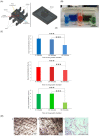
Fabrication and testing of the growth chamber. (A) The growth chamber is composed of a body and a lid. The body is divided in three compartments, one each for bones (yellow arrow), tendons (blue arrow), and muscles (red arrow). Both the body and the lid have barriers that keep the media separated. Media inlets and outlets were designed to allow for medium circulation. Scale bar = 1 cm. (B). A gel was placed at the bottom of the chamber. Liquids in different colours were added to the chamber. After 10 min, there was no sign of the liquids mixing. Scale bar = 1 cm. (C) Concentrations of the blue dye, red dye, and green dye were determined. One-way ANOVA and the Tukey post hoc test were performed, *** = p < 0.001. (D) MG-63 cells were seeded on the chamber and stained after 24 h. H&E staining of the chamber without cells (1), chamber incubated with cells (2), and MG-63 cells cultured in 2D tissue culture plastic(3). MG-63 cells were imaged at 10× magnification. In both chambers, there were no sign of cells on the bottom. Scale bar = 100 µm (1, 2) and 200 µm (3).
Figure 4
Figure 4
SEM and EDS imaging of the 3D in vitro model. Samples were freeze-dried for 8 h and imaged with SEM. SEM images show the structure of the bone, tendon, and muscle sections at 1000× and 10,000× (inserts) indicated magnifications. Scale bars = 10 µm for 1000× and 1 µm for 10,000×. EDS analysis shows the distribution of calcium and phosphorus within the sections. Images analysed at 1000×, scale bar 25 µm.
Figure 5
Figure 5
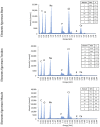
EDS analysis of the 3D in vitro model. EDS spectrum analysis indicates the highest amounts of calcium in the bone and tendon sections. Additionally, together with calcium and phosphorus, there are also high percentages of sodium and chloride.
Figure 6
Figure 6
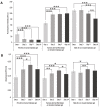
DNA content and metabolic activity assessed for cells grown on biphasic hydrogels. Cells were seeded with a cell density of 5000 cells/gel, 50,000 cells/gel, or 100,000 cells/gels in a 96-well plate to assess homeostasis. On days 1, 3, 7, and 14 after seeding, (A) DNA content was quantified using the PicoGreen assay, and the fluorescence intensity was read at an excitation of 480 nm and emission of 520 nm (n = 6); (B) the Alamar Blue assay was performed, and the absorbance was read at 570 nm and 600 nm (n = 9). Multi-way ANOVA and the Tukey post hoc test were performed. N.S = not significant; the other values are statistically significant with p < 0.05. Error bars show standard deviation. The increase in colour intensity indicates the cell seeding density, while the pattern represents the time point.
Figure 6
Figure 6
DNA content and metabolic activity assessed for cells grown on biphasic hydrogels. Cells were seeded with a cell density of 5000 cells/gel, 50,000 cells/gel, or 100,000 cells/gels in a 96-well plate to assess homeostasis. On days 1, 3, 7, and 14 after seeding, (A) DNA content was quantified using the PicoGreen assay, and the fluorescence intensity was read at an excitation of 480 nm and emission of 520 nm (n = 6); (B) the Alamar Blue assay was performed, and the absorbance was read at 570 nm and 600 nm (n = 9). Multi-way ANOVA and the Tukey post hoc test were performed. N.S = not significant; the other values are statistically significant with p < 0.05. Error bars show standard deviation. The increase in colour intensity indicates the cell seeding density, while the pattern represents the time point.
Figure 7
Figure 7
DNA content and metabolic activity assessed for cells seeded on triphasic and biphasic gels. MG-63 and human dermal fibroblast (HDF) cells were seeded with a seeding density of 50,000 cells/gel on the bone and tendon triphasic gels, respectively. Sket.4U cells were seeded on biphasic gels with a seeding density of 100,000 cells/gel. After 1, 3, 7, and 14 days of seeding, (A) the DNA content was determined. The fluorescence intensity was read at an excitation of 480 nm and emission of 520 nm. (B) The metabolic activity was assessed, and the absorbance was read at 570 nm and 600 nm. The experiment was performed in triplicate, and three readings were obtained per sample (n = 9). One-way ANOVA and the Tukey post hoc test were performed, * = p < 0.05, ** = p < 0.01, *** = p < 0.001. Error bars show standard deviation.
Figure 8
Figure 8
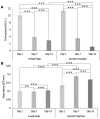
DNA content and metabolic activity of cells seeded on 3D models with topography cultured in a 6-well plate or growth chamber. (A) The DNA content was assessed with the PicoGreen assay. The fluorescence intensity was read at an excitation of 480 nm and emission of 520 nm (n = 24). (B) The cell metabolic activity was assessed with Alamar Blue. The absorbance was read at 570 nm and 600 nm (n = 36). Two-way ANOVA and the Tukey post hoc test were performed ** = p < 0.01, *** = p < 0.001. Error bars show standard deviation.
Figure 9
Figure 9
LDH release of cells seeded on a 3D model cultured in a 6-well plate or growth chamber. On days 1, 7, and 14, the release of LDH was detected with the LDH Cytotoxicity Assay. Absorbance was read at 490 nm and 680 nm. Two-way ANOVA and the Tukey post hoc test were performed * = p < 0.05, *** = p < 0.001. Error bars show standard deviation (n = 9).
Figure 10
Figure 10
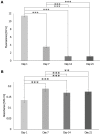
Evaluation of the DNA content and cell metabolic activity of cells seeded on 3D interface model in a growth chamber over 21 days. On days 1, 7, 14, and 21, (A) the DNA content was assessed with the PicoGreen assay. The fluorescence intensity was read at an excitation of 480 nm and emission of 520 nm (n = 24). (B) The cell metabolic activity was assessed with Alamar Blue. The absorbance was read at 570 nm and 600 nm. One-way ANOVA and the Tukey post hoc test were performed ** = p < 0.01, *** = p < 0.001. Error bars show standard deviation (n = 36).
Figure 11
Figure 11
Viability of cells seeded on the 3D interface model cultured in the growth chamber over 21 days. On days 1, 7, 14, and 21, cells were stained with Live/Dead™. Cells were imaged with a confocal microscope with 10× magnification. Live cells are stained green, while dead cells are stained red. Scale bar = 250 μm.
Figure 11
Figure 11
Viability of cells seeded on the 3D interface model cultured in the growth chamber over 21 days. On days 1, 7, 14, and 21, cells were stained with Live/Dead™. Cells were imaged with a confocal microscope with 10× magnification. Live cells are stained green, while dead cells are stained red. Scale bar = 250 μm.
Figure 12
Figure 12
Evaluation of the LDH release of cells seeded on the 3D interface model cultured in the growth chamber over 21 days. On days 1, 7, 14, and 21, LDH release was detected with the LDH Cytotoxicity Assay. The absorbance was read at 490 nm and 680 nm. One-way ANOVA and the Tukey post hoc test were performed *= p < 0.05,. Error bars show standard deviation (n = 9).
Figure 13
Figure 13
Expression of tissue-specific markers. The expression of tissue-specific markers was assessed with immunocytochemistry. On days 1 and 14, cells were stained with osteonectin (magenta), tenomodulin (green), and αSMA (red). Nuclei were stained with DAPI (blue). Cells were imaged with a confocal microscope. Scale bars are 100 µm for 10× magnification and 25 µm for 40× magnification.
Figure 14
Figure 14
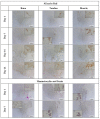
Histological staining of the native tissue. Mouse joints were decalcified for 8 days and paraffin sections of 10 µm were prepared. Paraffin sections were stained with alizarin red (A) and haematoxylin and eosin (B). Scale bars are 200 µm for 10× magnification and 50 µm for 40× magnification.
Figure 15
Figure 15
Histological assessment of the 3D interface model for matrix and calcium deposition. On days 1, 7, 14, and 21, the 3D model was sectioned and stained with alizarin red. Alizarin red stains calcium deposits in red/orange. Haematoxylin stains the nuclei purple, and eosin stains the cytoplasm pink. Scale bar are 500 µm for 4× magnification and 50 µm for 40× magnification.
Figure 15
Figure 15
Histological assessment of the 3D interface model for matrix and calcium deposition. On days 1, 7, 14, and 21, the 3D model was sectioned and stained with alizarin red. Alizarin red stains calcium deposits in red/orange. Haematoxylin stains the nuclei purple, and eosin stains the cytoplasm pink. Scale bar are 500 µm for 4× magnification and 50 µm for 40× magnification.

References

    1. Yang P.J., Temenoff J.S. Engineering orthopedic tissue interfaces. Tissue Eng. Part B Rev. 2009;15:127–141. doi: 10.1089/ten.teb.2008.0371. - DOI - PMC - PubMed
    1. Lu H.H., Subramony S.D., Boushell M.K., Zhang X. Tissue engineering strategies for the regeneration of orthopedic interfaces. Ann. Biomed. Eng. 2010;38:2142–2154. doi: 10.1007/s10439-010-0046-y. - DOI - PMC - PubMed
    1. Babatunde O.O., Jordan J.L., Van der Windt D.A., Hill J.C., Foster N.E., Protheroe J. Effective treatment options for musculoskeletal pain in primary care: A systematic overview of current evidence. PLoS ONE. 2017;12:e0178621. doi: 10.1371/journal.pone.0178621. - DOI - PMC - PubMed
    1. Balestri M.W., Morris R.H., Hunt J.A., Reinwald Y. Current advances on the regeneration of musculoskeletal interfaces. Tissue Eng. Part B Rev. 2021;27:548–571. doi: 10.1089/ten.teb.2020.0112. - DOI - PubMed
    1. Liu W., Lipner J., Xie J., Manning C.N., Thomopoulos S., Xia Y. Nanofiber scaffolds with gradients in mineral content for spatial control of osteogenesis. ACS Appl. Mater. Interfaces. 2014;6:2842–2849. doi: 10.1021/am405418g. - DOI - PMC - PubMed

Publication types

LinkOut - more resources