. 2023 Jan 8;15(2):412.
doi: 10.3390/cancers15020412.

Serum Mass Spectrometry Proteomics and Protein Set Identification in Response to FOLFOX-4 in Drug-Resistant Ovarian Carcinoma

Affiliations

Serum Mass Spectrometry Proteomics and Protein Set Identification in Response to FOLFOX-4 in Drug-Resistant Ovarian Carcinoma

Domenico D'Arca et al. Cancers (Basel). .

Abstract

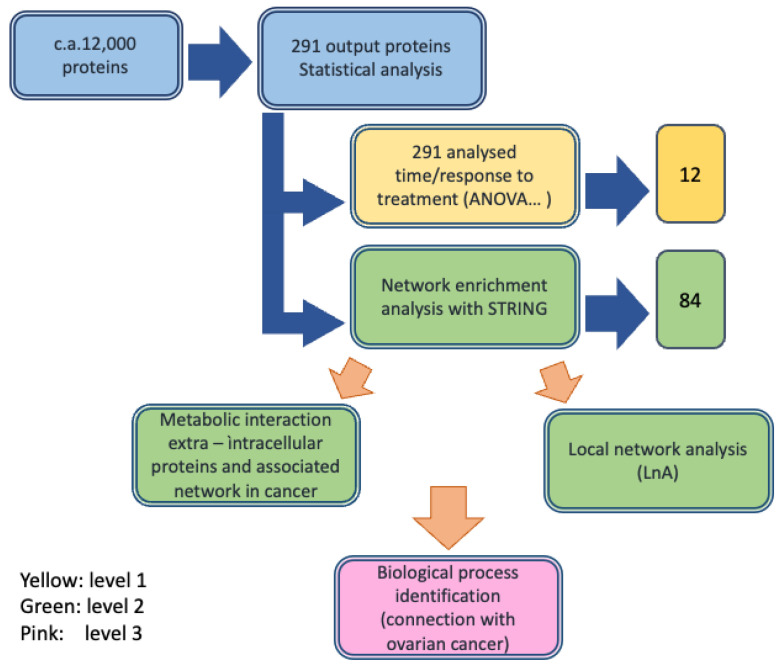
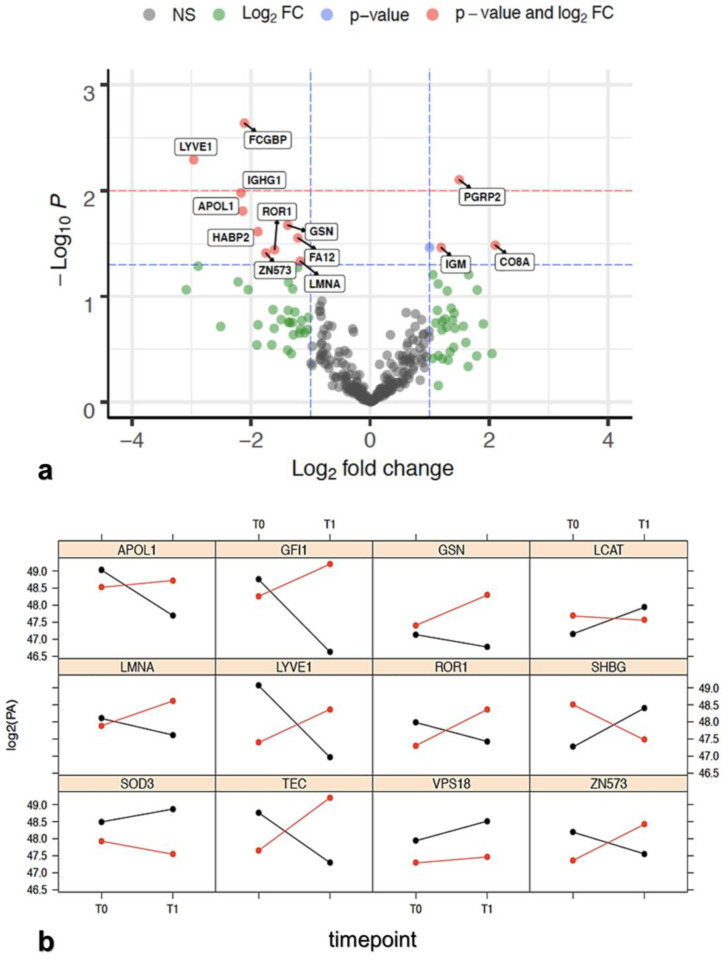
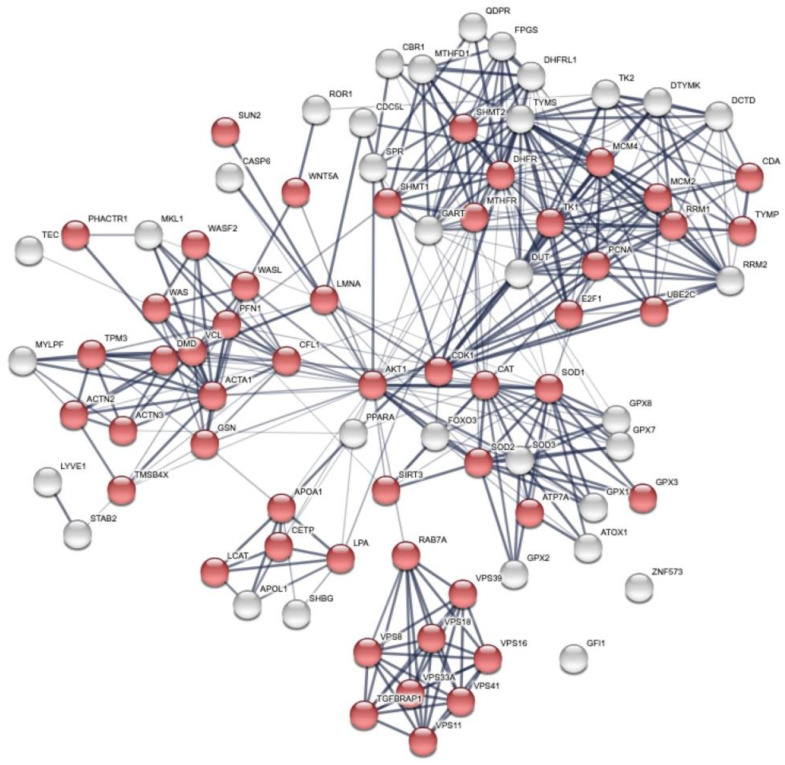
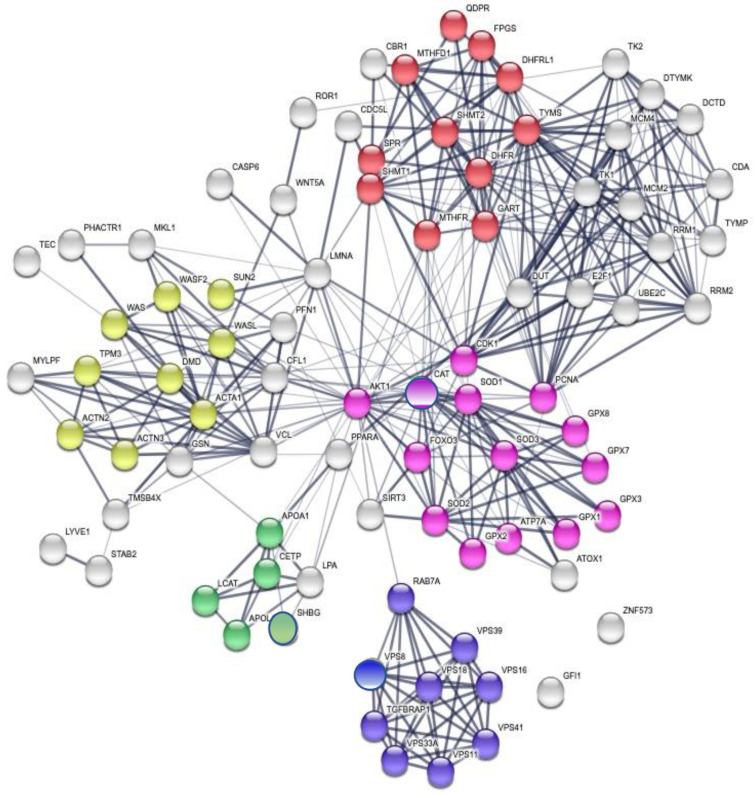
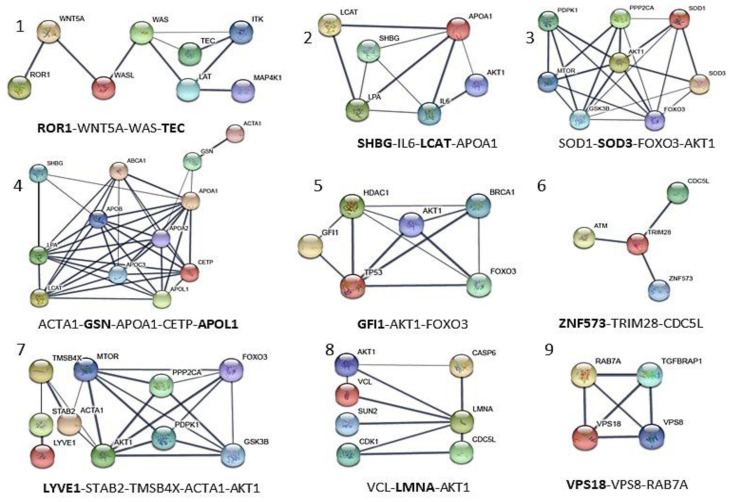
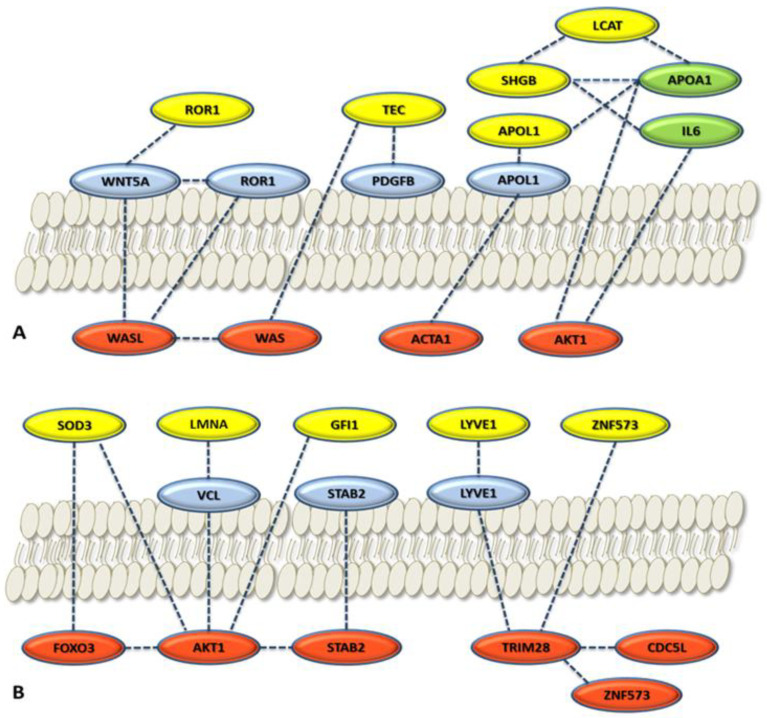
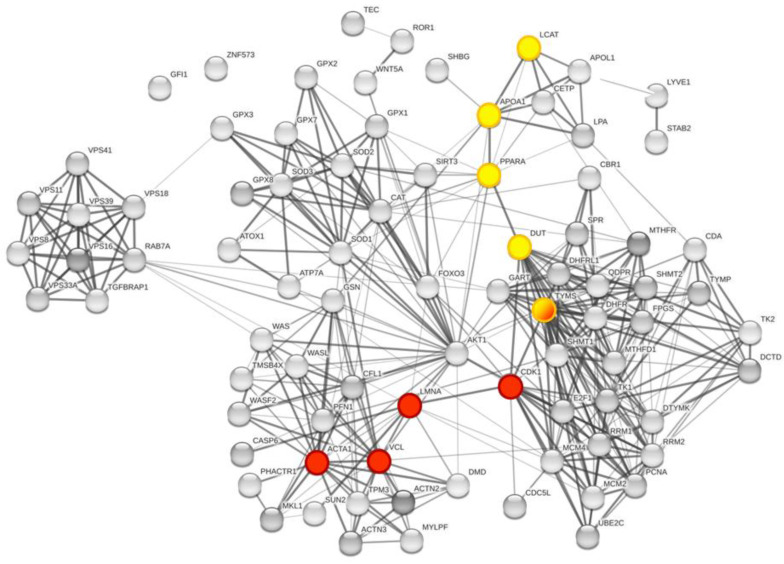
Ovarian cancer is a highly lethal gynecological malignancy. Drug resistance rapidly occurs, and different therapeutic approaches are needed. So far, no biomarkers have been discovered to predict early response to therapies in the case of multi-treated ovarian cancer patients. The aim of our investigation was to identify a protein panel and the molecular pathways involved in chemotherapy response through a combination of studying proteomics and network enrichment analysis by considering a subset of samples from a clinical setting. Differential mass spectrometry studies were performed on 14 serum samples from patients with heavily pretreated platinum-resistant ovarian cancer who received the FOLFOX-4 regimen as a salvage therapy. The serum was analyzed at baseline time (T0) before FOLFOX-4 treatment, and before the second cycle of treatment (T1), with the aim of understanding if it was possible, after a first treatment cycle, to detect significant proteome changes that could be associated with patients responses to therapy. A total of 291 shared expressed proteins was identified and 12 proteins were finally selected between patients who attained partial response or no-response to chemotherapy when both response to therapy and time dependence (T0, T1) were considered in the statistical analysis. The protein panel included APOL1, GSN, GFI1, LCATL, MNA, LYVE1, ROR1, SHBG, SOD3, TEC, VPS18, and ZNF573. Using a bioinformatics network enrichment approach and metanalysis study, relationships between serum and cellular proteins were identified. An analysis of protein networks was conducted and identified at least three biological processes with functional and therapeutic significance in ovarian cancer, including lipoproteins metabolic process, structural component modulation in relation to cellular apoptosis and autophagy, and cellular oxidative stress response. Five proteins were almost independent from the network (LYVE1, ROR1, TEC, GFI1, and ZNF573). All proteins were associated with response to drug-resistant ovarian cancer resistant and were mechanistically connected to the pathways associated with cancer arrest. These results can be the basis for extending a biomarker discovery process to a clinical trial, as an early predictive tool of chemo-response to FOLFOX-4 of heavily treated ovarian cancer patients and for supporting the oncologist to continue or to interrupt the therapy.

Keywords: FOLFOX-4; cancer molecular pathways; mass spectrometry proteomics; network enrichment analysis; ovarian cancer; protein panel; serum samples; time lapse detection.


Conflict of interest statement

The authors declare no conflict of interest. The funders had no role in the design of the study; in the collection, analyses, or interpretation of data; in the writing of the manuscript; or in the decision to publish the results.

Figures

Figure 1
Figure 1
Workflow of the protein identification process in ovarian cancer serum samples performed through label free differential mass spectrometry analysis and integration with the bioinformatic analysis.
Figure 2
Figure 2
(a) Volcano plot showing -log10(p-value) versus log2(FCR/FCNR). Horizontal lines indicate 0.05 (blue) and 0.01 (red) p-values. Proteins statistically significant (p < 0.05) and with a FC > 1 were reported alongside with their names. Protein in red dot fits the FC and statistical significance criteria, blue dot fits only the statistical criteria, the green dot fits only the FC criteria, and the grey dot does not fit either criteria. Proteins over the blue dashed line showing p < 0.05 are reported in Table 1. Data for each protein were taken from the protein identification table of the MS analysis elaboration. (Supplementary Materials doi.org/10.15490/fairdomhub.1.datafile.4074.1); (b) log2 protein abundance expression profile between T0 and T1 relative to the 10 proteins reported in Table 2. SOD3 and VPS18, taken from Table S5a, are added as an example of non-intersecting proteins. The red color is related to NR patients, while the black color is related to PR. When the red and black lines intersect, it is intended that the contribution of the time in response status is relevant and, consequently, the interaction between response and treatment as well. Data are elaborated from the file named “Report progenesis _all rows_all data for biostatistics.doi.org/10.15490/fairdomhub.1. datafile.4074.1.”
Figure 3
Figure 3
Global network visualization based on STRING pathway enrichment analysis of the 12 DEP proteins + TYMS and DHFR showing the most extended biological process containing the protein panel. Details are reported in the main text. Red spheres represent the cellular metabolism organization biological process with the following STRING features: GO:0016043 and FDR 51/5163.
Figure 4
Figure 4
Global network visualization based on the STRING pathway enrichment analysis of the 14 selected proteins (12 + TYMS or TS and DHFR). The network shows the most relevant biological process containing the protein panel. Details are reported in the main text. The STRING features are the following: yellow spheres, actin-filament based movement and regulation (GO:0030048, FDR 1.31 × 10⁻⁷, 9/105); green spheres, cholesterol metabolic process (GO:FDR 2.3 × 10⁻³); violet spheres, endosome to lysosome transport (GO:0008333, FDR 1.78 × 10⁻⁸, 8/49); pink spheres, cellular response to oxidative stress (GO:0034599, FDR 5.36 × 10⁻¹⁰, 14/22); red spheres, pteridine-containing compounds biological process (GO:0042558, FDR 9.37 × 10⁻¹⁴, 11/33). A detailed GO analysis shows that the four most relevant biological processes involving the protein panel are related to vesicle trafficking process, lipoproteins associated metabolic process, structural component modulation in relation to cellular apoptosis and autophagy, and cellular oxidative stress response. The principal biological processes are well connected to the purine metabolism and apoptotic process generated by STRING around the 5-FU and leucovorin targets, i.e., TYMS and the TS cycle protein, DHFR.
Figure 5
Figure 5
Local network interaction generated for each of the 12 proteins of the panel obtained through STRING upon elaboration of data from Figure 3 and GeneCards databases. The most relevant interconnections based on confidence feature (value of confidence >0.700 and p < 1.0 × 10⁻¹⁶) are also visualized in Figure 6. Each local network (1–9) shows the relevant protein connections written in the bottom, and proteins of the MS panel are reported in bold. SOD3 and VPS18, taken from Table S5a, are added as internal control proteins.
Figure 6
Figure 6
Local network connections for cytoplasmatic proteins (red), membrane proteins (blue), and serum proteins (yellow and green). The selected proteins of the panel were considered: (A) Panel proteins considered are ROR1, TEC, SHBG, LCAT, and APOL1; (B) panel proteins considered are SOD3, LMNA, GFI1, LYVE1, and ZNF573. Yellow circles, panel proteins selected; light green circles, relevant serum proteins for ovarian cancer in the network. Localization is based on GeneCards. The proteins reported not belonging to the panel come from the STRING local network analysis and GeneCards elaboration (Figure 5).
Figure 7
Figure 7
Global network visualization based on STRING pathway enrichment analysis focused on TYMS and DHFR. In the global network representation, the interaction pathway between the TYMS-DHFR protein network and the proteins of the panel identified through MS study are shown, respectively, in red and yellow. The represented nodes are the closest connection possible for the proteins of interest. The two main pathways identified are: TYMS-CDK1-LMNA-VCL-ACTA1 (red nodes) and TYMS-DUT-PPARA-APOA1-LCAT (yellow nodes). TYMS is half yellow/half red.

References

    1. Momenimovahed Z., Tiznobaik A., Taheri S., Salehiniya H. Ovarian Cancer in the World: Epidemiology and Risk Factors. Int. J. Womens. Health. 2019;11:287–299. doi: 10.2147/IJWH.S197604. - DOI - PMC - PubMed
    1. Bowtell D.D., Böhm S., Ahmed A.A., Aspuria P.-J., Bast Jr R.C., Beral V., Berek J.S., Birrer M.J., Blagden S., Bookman M.A., et al. Rethinking Ovarian Cancer II: Reducing Mortality from High-Grade Serous Ovarian Cancer. Nat. Rev. Cancer. 2015;15:668–679. doi: 10.1038/nrc4019. - DOI - PMC - PubMed
    1. Lorusso D., Fontanella C., Maltese G., Lepori S., Tripodi E., Bogani G., Raspagliesi F. The Safety of Antiangiogenic Agents and PARP Inhibitors in Platinum-Sensitive Recurrent Ovarian Cancer. Expert Opin. Drug Saf. 2017;16:687–696. doi: 10.1080/14740338.2017.1325871. - DOI - PubMed
    1. Pignata S., Cecere S.C., Du Bois A., Harter P., Heitz F. Treatment of Recurrent Ovarian Cancer. Ann. Oncol. 2017;28:viii51–viii56. doi: 10.1093/annonc/mdx441. - DOI - PubMed
    1. Raymond E., Buquet-Fagot C., Djelloul S., Mester J., Cvitkovic E., Allain P., Louvet C., Gespach C. Antitumor Activity of Oxaliplatin in Combination with 5-Fluorouracil and the Thymidylate Synthase Inhibitor AG337 in Human Colon, Breast and Ovarian Cancers. Anticancer. Drugs. 1997;8:876–885. doi: 10.1097/00001813-199710000-00009. - DOI - PubMed