. 2023 Jan 12;15(2):489.
doi: 10.3390/cancers15020489.

Libertellenone T, a Novel Compound Isolated from Endolichenic Fungus, Induces G2/M Phase Arrest, Apoptosis, and Autophagy by Activating the ROS/JNK Pathway in Colorectal Cancer Cells

Affiliations

Libertellenone T, a Novel Compound Isolated from Endolichenic Fungus, Induces G2/M Phase Arrest, Apoptosis, and Autophagy by Activating the ROS/JNK Pathway in Colorectal Cancer Cells

Chathurika D B Gamage et al. Cancers (Basel). .

Abstract

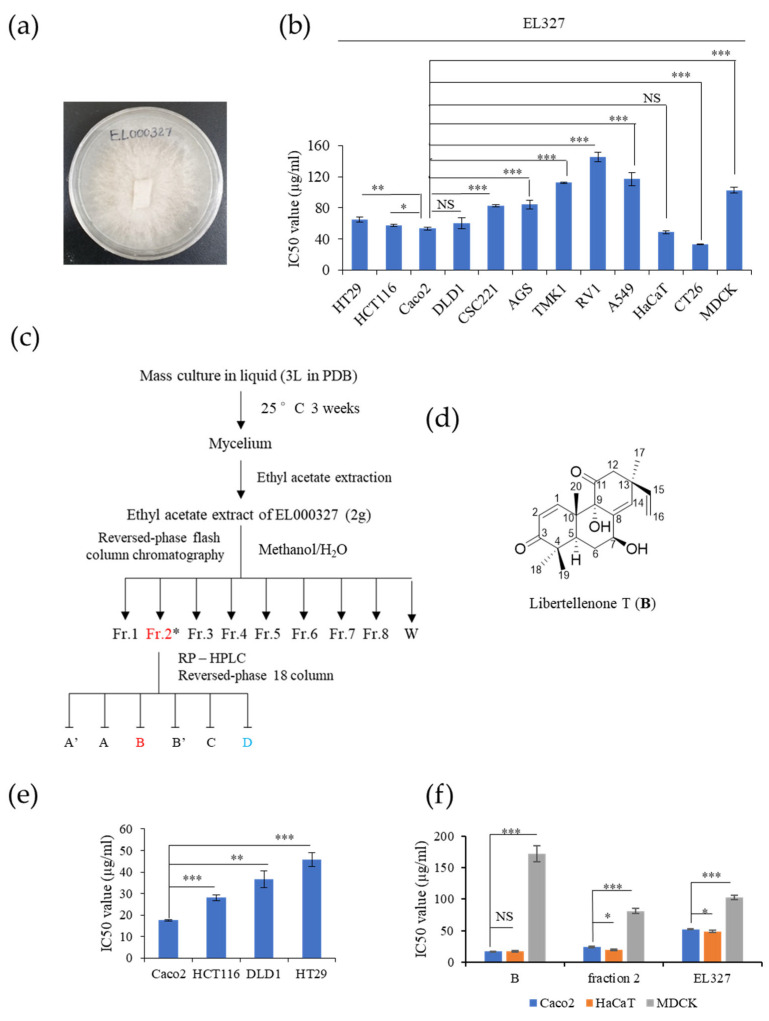
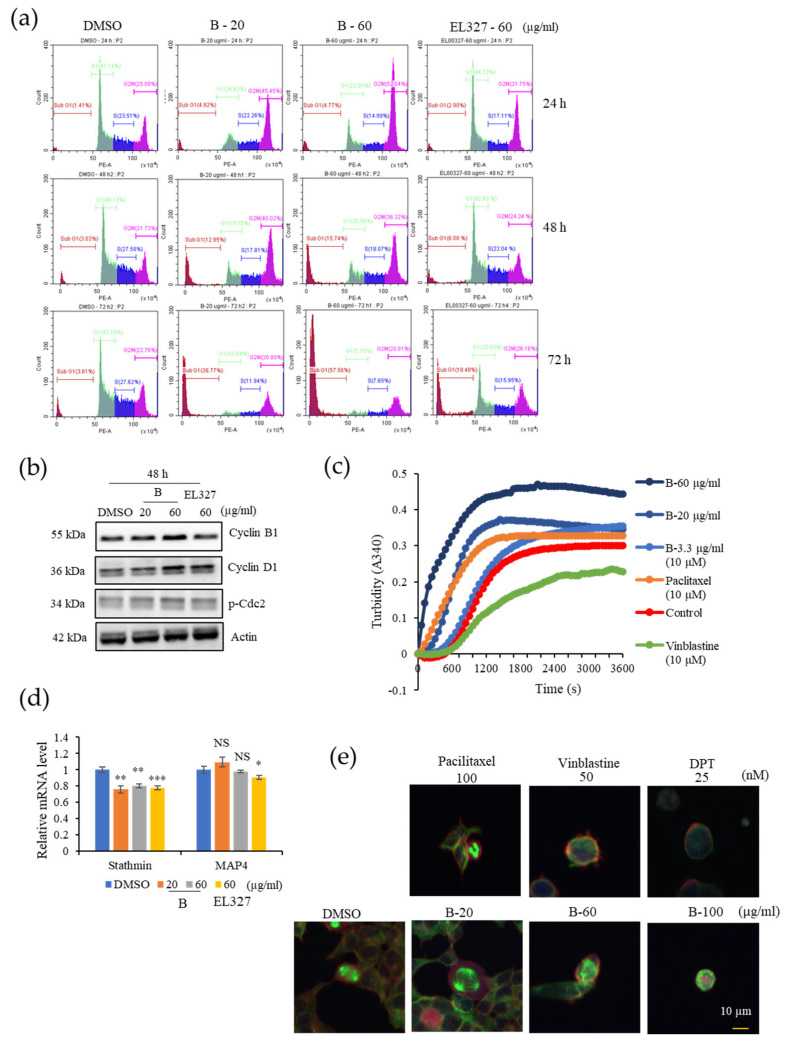
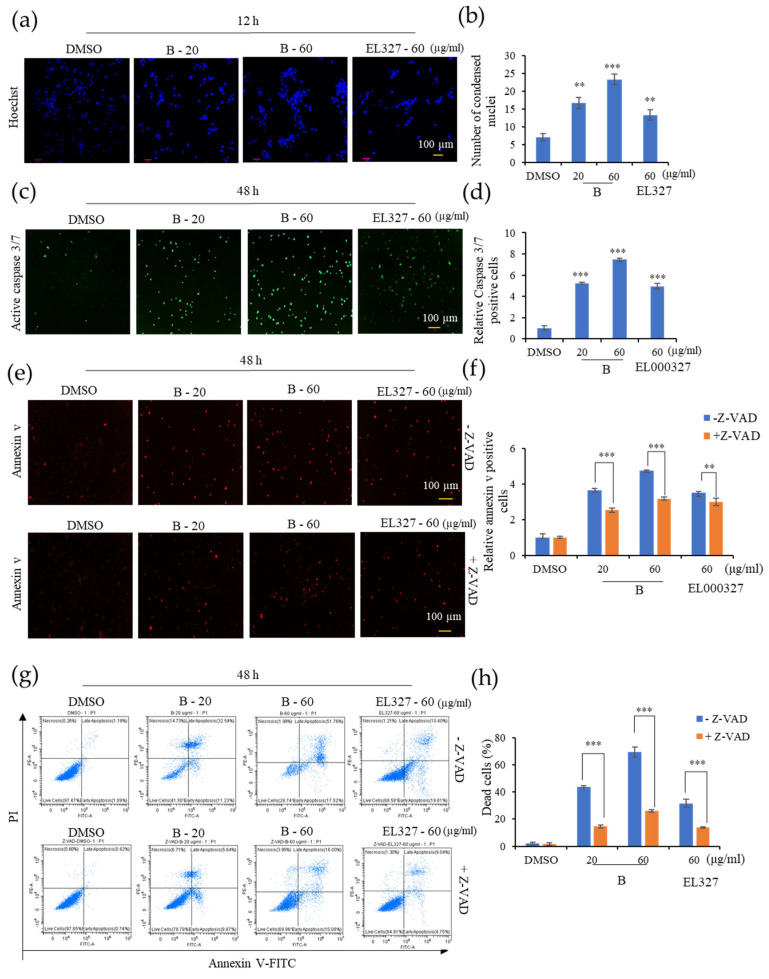
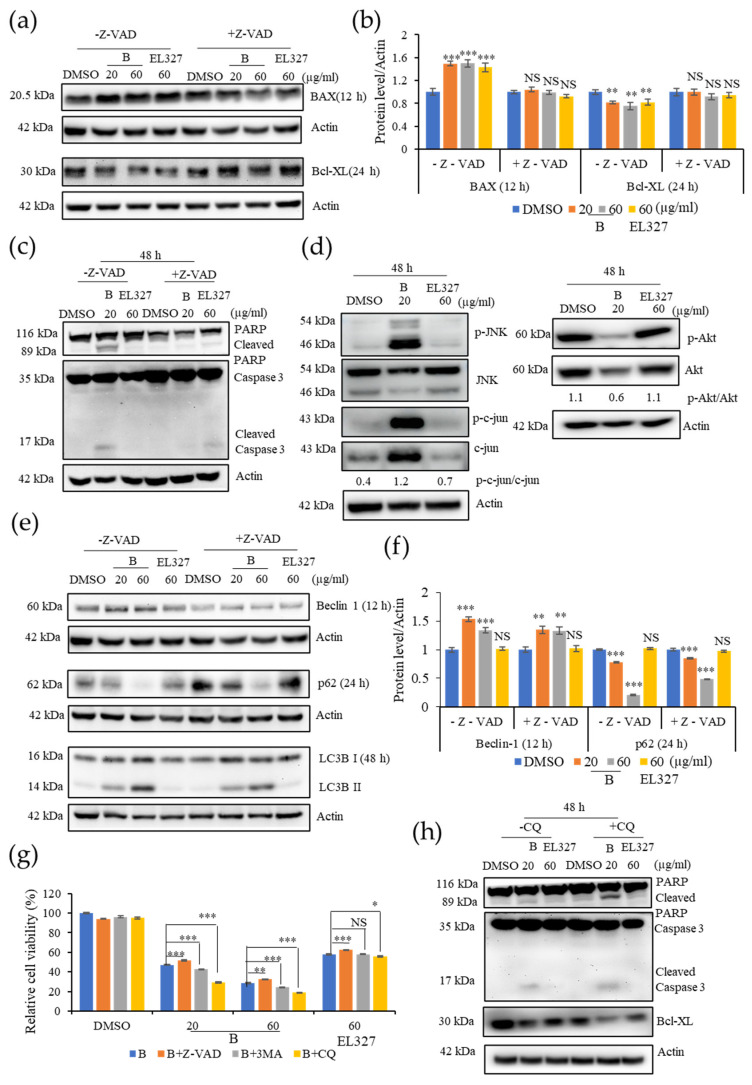
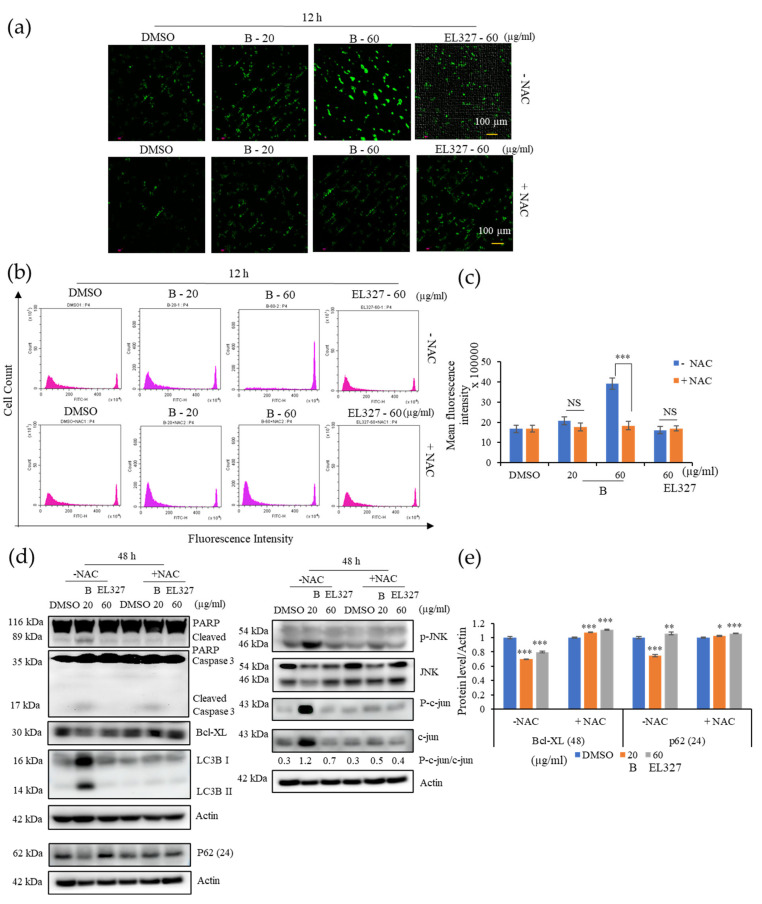
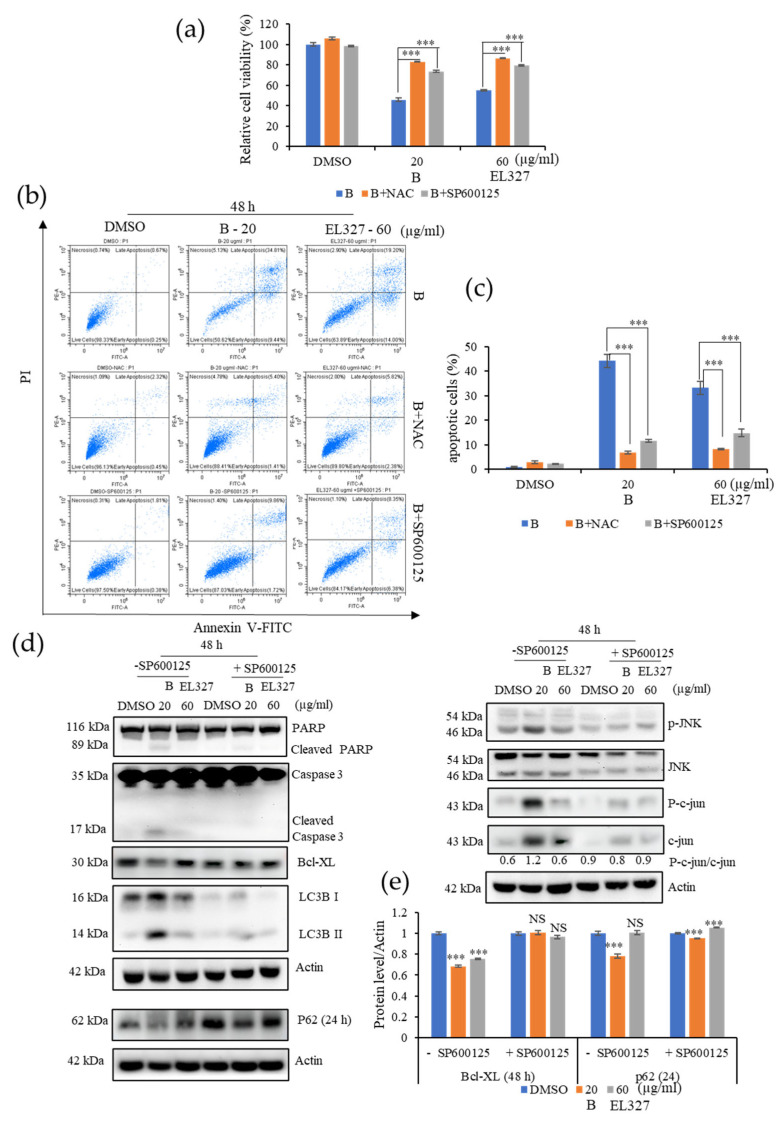
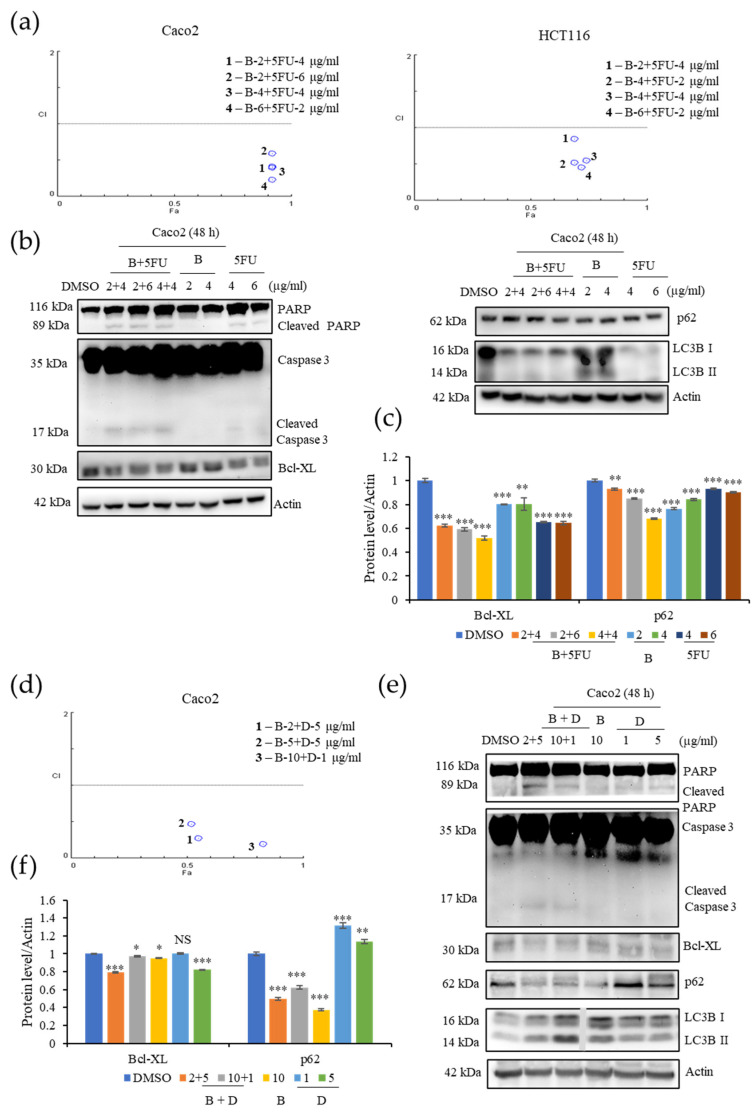
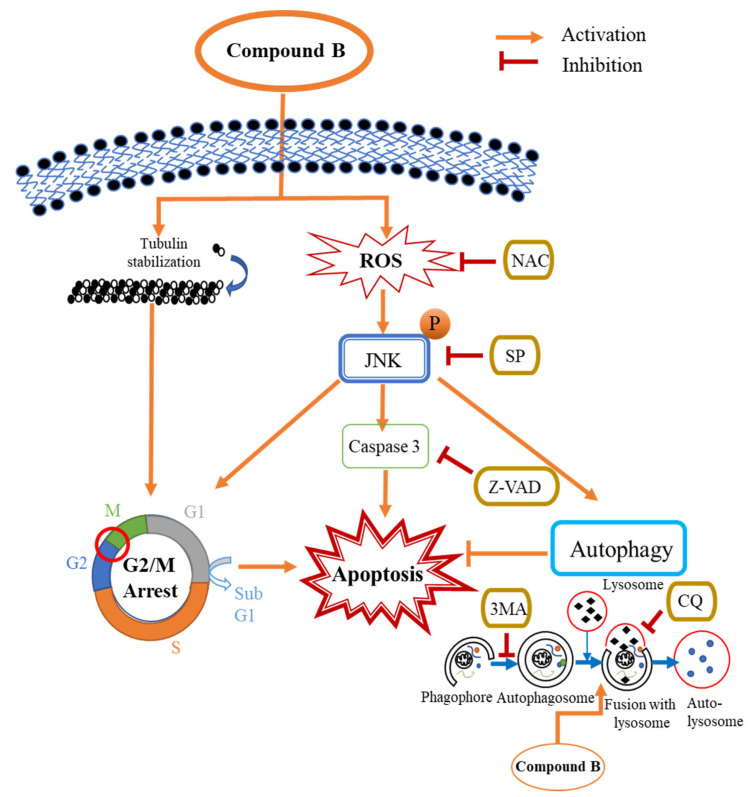
Colorectal cancer (CRC) is the third most deadly type of cancer in the world and continuous investigations are required to discover novel therapeutics for CRC. Induction of apoptosis is one of the promising strategies to inhibit cancers. Here, we have identified a novel compound, Libertellenone T (B), isolated from crude extracts of the endolichenic fungus from Pseudoplectania sp. (EL000327) and investigated the mechanism of action. CRC cells treated by B were subjected to apoptosis detection assays, immunofluorescence imaging, and molecular analyses such as immunoblotting and QRT-PCR. Our findings revealed that B induced CRC cell death via multiple mechanisms including G2/M phase arrest caused by microtubule stabilization and caspase-dependent apoptosis. Further studies revealed that B induced the generation of reactive oxygen species (ROS) attributed to activating the JNK signaling pathway by which apoptosis and autophagy was induced in Caco2 cells. Moreover, B exhibited good synergistic effects when combined with the well-known anticancer drug, 5-FU, and another cytotoxic novel compound D, which was isolated from the same crude extract of EL000327. Overall, Libertellenone T induces G2/M phase arrest, apoptosis, and autophagy via activating the ROS/JNK pathway in CRC. Thus, B may be a potential anticancer therapeutic against CRC that is suitable for clinical applications.

Keywords: CRC; G2/M phase arrest; Libertellenone T; ROS/JNK signaling; apoptosis; autophagy.


Conflict of interest statement

The authors declare no conflict of interest.

Figures

Figure 1
Figure 1
Compound B isolated from the crude extract of EL000327 exhibited cytotoxicity toward the human CRC cell line, Caco2. (a) Image of the endolichenic fungus, EL000327, belonging to Pseudoplectania sp. isolated from the lichen Graphis. (b) IC50 values of EL000327 in HT29, HCT116, Caco2, DLD1, CSC221, TMK1, RV1, A549, HaCaT, CT26, and MDCK cells. (c) Schematic representation of the process for the purification of compound B from the crude extract, EL000327. (d) Chemical structure of the novel compound, B. (e) IC50 values of human CRC cells Caco2, HCT116, DLD1, and HT29 after treatment with B for 48 h. (f) Comparison of IC50 values of the CRC cells Caco2 and non-cancer cell lines HaCaT and MDCK treated with single compound B, fraction 2, or crude extract, EL000327 for 48 h. Results are representative of three independent experiments. Data represent the mean ± S.D. * p < 0.05, ** p < 0.01, *** p < 0.001, NS: no significant difference (p > 0.05) compared with the Caco2 cells.
Figure 2
Figure 2
B induces G2/M phase arrest in Caco2 cells by inducing tubulin polymerization. (a) The cell-cycle distribution of Caco2 cells treated with B (20, 60 µg/mL) or EL000327 (60 µg/mL) for 24 h, 48 h, and 72 h as assessed by flow cytometry. (b) Western blot analysis of cell cycle regulating proteins, Cyclin B1, D1, and p-Cdc2 after treatment with B (20, 60 µg/mL) or EL000327 (60 µg/mL) for 24 h, 48 h, and 72 h. (c) Effect of B on tubulin polymerization in vitro, at concentrations of 20, 60, and 3.3 µg/mL. DMSO, paclitaxel, microtubule stabilizer (10 µM), and vinblastine microtubule destabilizer (10 µM) were used as the controls. (d) Relative mRNA levels of stathmin and MAP4, which are associated with microtubule destabilization and stabilization, respectively, after treatment with B (20, 60 µg/mL) or EL000327 (60 µg/mL) for 48 h. (e) Immunofluorescence microscopy of the microtubule organization in the Caco2 cells after treatment with B (20, 60, 100 µg/mL), paclitaxel (100 nM), vinblastine (50 nM) or DPT microtubule destabilizer (25 nM) for 24 h. Actin was stained with Alexa Fluor 568 phalloidin (red), microtubules were stained with α-tubulin antibodies (green), and DNA was stained with DAPI (blue). Results are representative of three independent experiments. Data represent the mean ± S.D. * p < 0.05, ** p < 0.01, *** p < 0.001, NS: no significant difference (p > 0.05) compared with the DMSO-treated control group.
Figure 3
Figure 3
B induces caspase dependent apoptosis in Caco2 cells. (a) Nuclei condensation of Caco2 cells upon treatment with B (20, 60 µg/mL) or EL000327 (60 µg/mL) for 12 h, as determined by Hoechst staining. Arrowheads indicate nuclear condensation in cells. (b) Quantification of condensed nuclei in Caco2 cells treated with indicated concentrations of B or EL000327. (c) Caspase 3/7 (green) staining of Caco2 cells treated with B (20, 60 µg/mL) or EL000327 (60 µg/mL) for 48 h. (d) Quantification of apoptotic cells stained with Caspase 3/7 after treatment with the indicated concentrations of B or EL000327. (e) Annexin V staining of Caco2 cells treated with B (20, 60 µg/mL) or EL000327 (60 µg/mL) for 48 h in the presence or absence of the caspase inhibitor Z-VAD-FMK (10 µM). (f) Quantification of apoptotic cells stained with Annexin V after treatment with the indicated concentrations of B or EL000327 in the presence or absence of Z-VAD-FMK (10 µM). (g) Flow cytometric analysis of dead cells stained by Annexin v-FITC (apoptotic cells) and PI (necrotic cells) upon the treatment of B (20, 60 µg/mL) or EL000327 (60 µg/mL) for 48 h in the presence or absence of Z-VAD-FMK (10 µM). (h) Quantification of the percentage of apoptotic cells treated with indicated concentrations of B and EL000327 and analyzed by flow cytometry in the presence or absence of Z-VAD-FMK (10 µM). Results are representative of three independent experiments. Data represent the mean ± S.D. ** p < 0.01, *** p < 0.001; compared with the DMSO-treated control or Z-VAD-FMK treated group.
Figure 4
Figure 4
Inhibition of B induced autophagy increases apoptosis in Caco2 cells. (a) Western blot analysis of the pro-apoptotic protein BAX and the anti-apoptotic protein Bcl-xL treated by B (20 or 60 µg/mL) or EL000327 (60 µg/mL) for 12 or 24 h in the presence or absence of Z-VAD-FMK (10 µM). (b) Quantification of BAX and Bcl-XL protein expressions. (c) Western blot of apoptotic proteins; PARP, Caspase-3treated by B (20 or 60 µg/mL) or EL000327 (60 µg/mL) for 48 h in the presence or absence of Z-VAD-FMK. (d) Expressions of the apoptotic signaling pathway related proteins p-JNK, JNK, p-c-jun, c-jun, p-AKT, and AKT in Caco2 cells treated with B (20 µg/mL) or EL000327 (60 µg/mL) for 48 h, as analyzed by Western blotting. (e) Western blot of autophagy related proteins; Beclin 1 (12 h), p62 (24 h), and LC3BI/II (48 h) in Caco2 cells pre-incubated with or without Z-VAD-FMK, and treated with B (20, 60 µg/mL) or EL000327 (60 µg/mL). (f) Quantification of Beclin 1 and p62 protein expressions. (g) The relative percentage cell viability of Caco2 cells treated with B (20, 60 µg/mL) or EL000327 (60 µg/mL) for 48 h, with or without Z-VAD-FMK (10 µM) and autophagy inhibitors 3 MA (1 mM) and CQ (10 µM). (h) Expression levels of PARP, caspase-3, and Bcl-xL determined by Western blot analysis after treatment with B (20, µg/mL) or EL000327 (60 µg/mL) for 48 h in the presence or absence of CQ (10 µM). Data represent the mean ± S.D. * p < 0.05, ** p < 0.01, *** p < 0.001; NS: no significant difference (p > 0.05), compared with the Z-VAD-FMK, 3MA, and CQ treated groups or the DMSO-treated control.
Figure 5
Figure 5
B induces ROS generation and activates JNK signaling in Caco2 cells. (a) Intracellular ROS generation was detected by fluorescence microscopy using DCFH-DA (10 µM) in Caco2 cells treated with B (20, 60 µg/mL) or EL000327 (60 µg/mL) for 12 h with or without the ROS inhibitor NAC (5 mM). (b) Flow cytometric analysis of the fluorescence intensity of Caco2 cells preincubated with DCFH-DA (10 µM) and treated with B (20, 60 µg/mL) or EL000327 (60 µg/mL) for 12 h with or without NAC (5 mM). (c) Quantification of the mean fluorescence intensity of Caco2 cells preincubated with DCFH-DA (10 µM) and treated with the indicated concentrations of B for 12 h in the presence or absence of NAC. (d) Western blot analysis of PARP, caspase-3, Bcl-xL, p62, LC3BI/II, p-JNK, JNK, p-c-jun, and c-jun protein expression after treatment with B (20, µg/mL) or EL000327 (60 µg/mL) for 24 or 48 h, with or without NAC (5 mM). (e) Quantification of Bcl-XL and p62 protein expressions in the presence or absence of NAC. Data represent the mean ± S.D. * p < 0.05, ** p < 0.01, *** p < 0.001; NS: no significant difference (p > 0.05) compared with the NAC-treated group or the DMSO-treated control.
Figure 6
Figure 6
B activates ROS/JNK mediated apoptosis and autophagy in Caco2 cells. (a) The relative percentage cell viability of Caco2 cells detected after treatment with B (20 µg/mL) or EL000327 (60 µg/mL) for 48 h, with or without NAC (5 mM) or the JNK inhibitor SP600125 (10 µM). (b) Flow cytometric analysis of dead cells stained by Annexin V-FITC and PI after treatment with B (20 µg/mL) or EL000327 (60 µg/mL) for 48 h, with or without NAC (5 mM) or SP600125 (10 µM). (c) Quantification of the percentage of apoptotic cells after treatment with the indicated concentrations of B or EL000327 for 48 h with or without NAC and SP600125 and analyzed by flow cytometry. (d) Western blot analysis of apoptosis, autophagy, and the JNK signaling pathway related protein expression in Caco2 cells treated with B (20 µg/mL) or EL000327 (60 µg/mL) for 24 or 48 h, with or without SP600125 (10 µM). (e) Quantification of Bcl-XL and p62 protein expressions in the presence or absence of SP600125. Data represent the mean ± S.D. *** p < 0.001 compared with the NAC- and SP600125-treated groups or the DMSO-treated control. NS: no significant difference.
Figure 7
Figure 7
B shows synergy with 5-FU and with D, a compound isolated from the crude extract of EL000327 on the CRC cells. (a) Fa-CI plot of combination treatment with 5-FU (2, 4 or 6 µg/mL) and B (2, 4 or 6 µg/mL) on the Caco2 cells and the Fa-CI plot of combination treatment with 5-FU (2 or 4 µg/mL) and B (2, 4 or 6 µg/mL) on the HCT116 cells. (b) Expression of apoptosis and autophagy related protein in Caco2 cells after combination treatment with 5-FU (4 or 6 µg/mL) and B (2 or 4 µg/mL) or B (2 or 4 µg/mL) or 5FU (4 or 6 µg/mL) individually for 48 h, as detected by Western blotting. (c) Quantification of Bcl-XL and p62 protein expression after the treatment with B+5FU or B or 5FU at the indicated concentrations. (d) Fa-CI plot of combination treatment with D (5 or 1 µg/mL) and B (2, 5 or 10 µg/mL) on the Caco2 cells. (e) Western blot analysis of apoptosis and autophagy related protein expression in the Caco2 cells after combination treatment with D (5 or 1 µg/mL) and B (2 or10 µg/mL) or B (10 µg/mL) or D (1 or 5 µg/mL) individually for 48 h. (e) Quantification of Bcl-XL and p62 protein expression after the treatment with B + D or B or D at the indicated concentrations. Data represent the mean ± S.D. * p < 0.05, ** p < 0.01, *** p < 0.001; NS: no significant difference (p > 0.05) compared with the NAC-treated group or the DMSO-treated control.
Figure 8
Figure 8
Schematic representation of the proposed mechanism for B-induced apoptosis and autophagy in the Caco2 cells. B induces apoptosis in Caco2 cells through the induction of G2/M phase arrest caused by tubulin stabilization. Simultaneously, B induces apoptosis and autophagy in Caco2 cells via the ROS/JNK signaling pathway. Inhibition of ROS, JNK, and caspases by NAC, SP600125, and Z-VAD-FMK, respectively, decreases B induced caspase-dependent apoptosis in Caco2 cells. 3MA and CQ inhibit autophagy in the Caco2 cells. The inhibition of autophagy by preventing the fusion of lysosomes with autophagosomes by CQ significantly increases the induction of caspase-dependent apoptosis by B in the Caco2 cells.

References

    1. ACS Colorectal Cancer Facts and Figures 2020–2022. Am. Cancer Soc. 2020;66:48.
    1. Honegger R., Axe L., Edwards D. Bacterial epibionts and endolichenic actinobacteria and fungi in the Lower Devonian lichen Chlorolichenomycites salopensis. Fungal Biol. 2013;117:512–518. doi: 10.1016/j.funbio.2013.05.003. - DOI - PubMed
    1. Kellogg J.J., Raja H.A. Endolichenic fungi: A new source of rich bioactive secondary metabolites on the horizon. Phytochem. Rev. 2017;16:271–293. doi: 10.1007/s11101-016-9473-1. - DOI
    1. Suryanarayanan T.S., Thirunavukkarasu N. Endolichenic fungi: The lesser known fungal associates of lichens. Mycology. 2017;8:189–196. doi: 10.1080/21501203.2017.1352048. - DOI - PMC - PubMed
    1. Yang Y., Bae W.K., Nam S.J., Jeong M.H., Zhou R., Park S.Y., Taş İ., Hwang Y.H., Park M.S., Chung I.J., et al. Acetonic extracts of the endolichenic fungus EL002332 isolated from Endocarpon pusillum exhibits anticancer activity in human gastric cancer cells. Phytomedicine. 2018;40:106–115. doi: 10.1016/j.phymed.2018.01.006. - DOI - PubMed