

Harnessing on Genetic Variability and Diversity of Rice (Oryza sativa L.) Genotypes Based on Quantitative and Qualitative Traits for Desirable Crossing Materials
- PMID: 36672751
- PMCID: PMC9858721
- DOI: 10.3390/genes14010010
Harnessing on Genetic Variability and Diversity of Rice (Oryza sativa L.) Genotypes Based on Quantitative and Qualitative Traits for Desirable Crossing Materials
Abstract
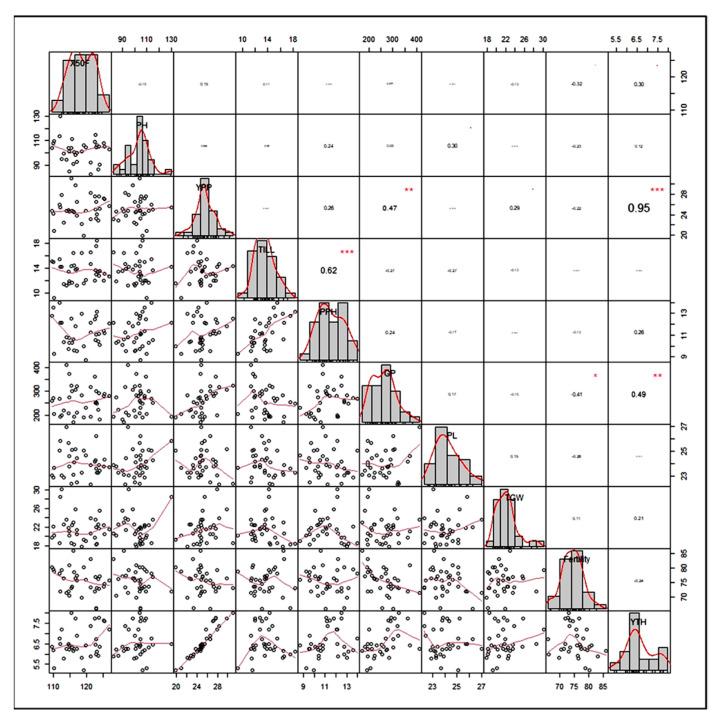
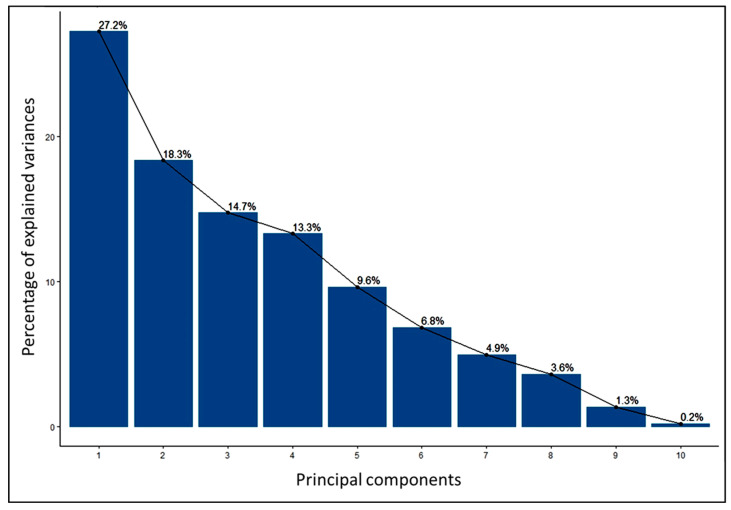
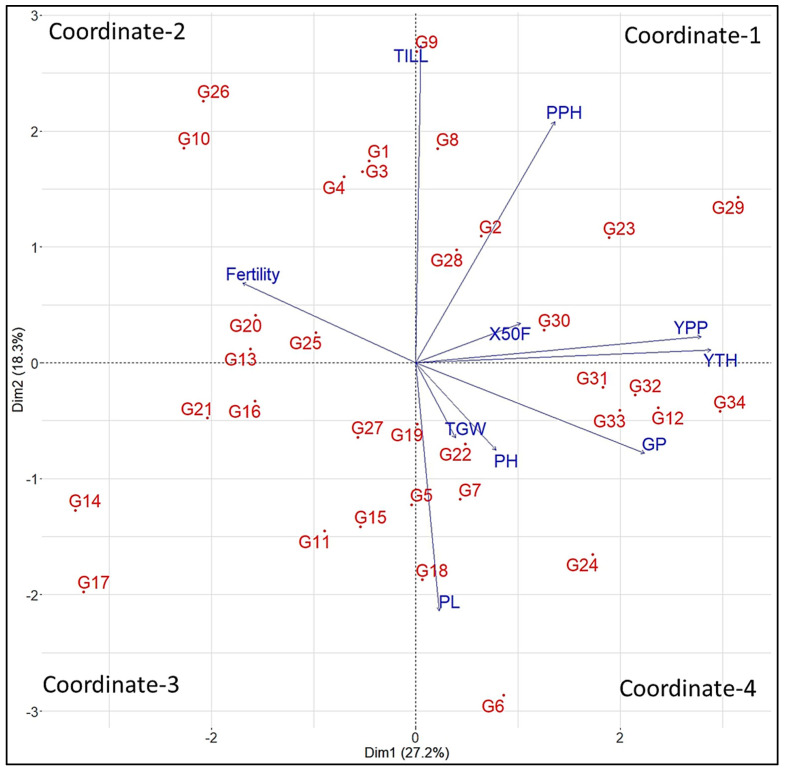
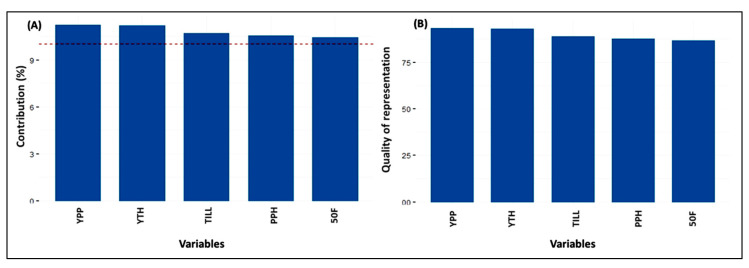
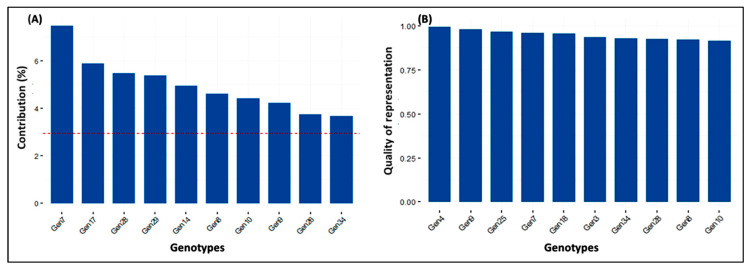
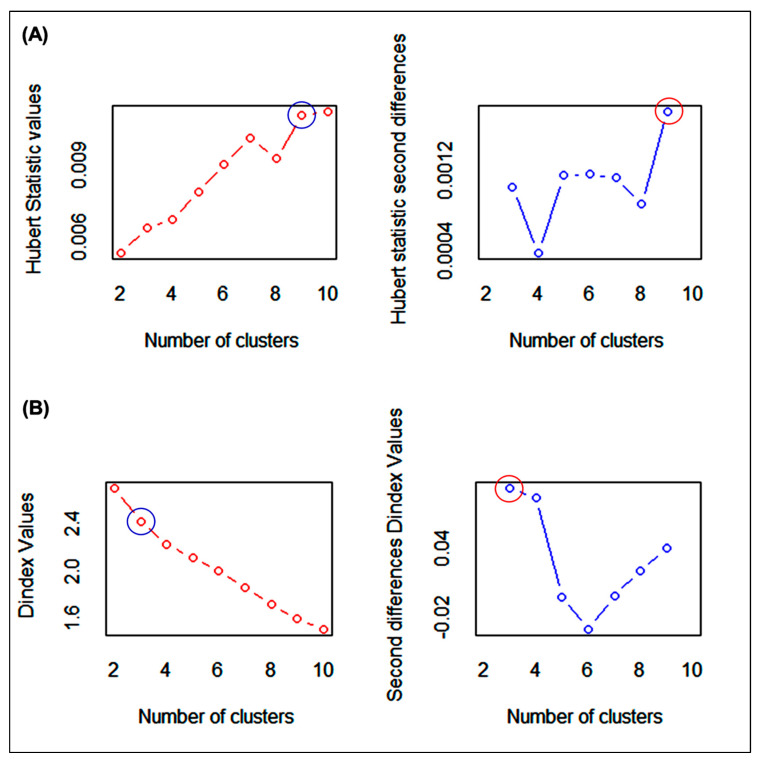
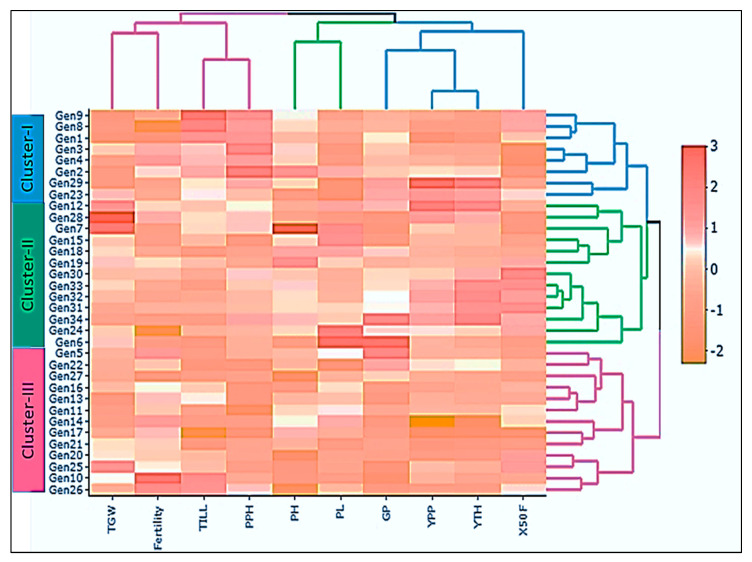
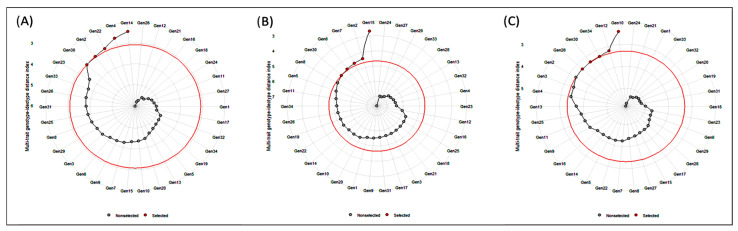
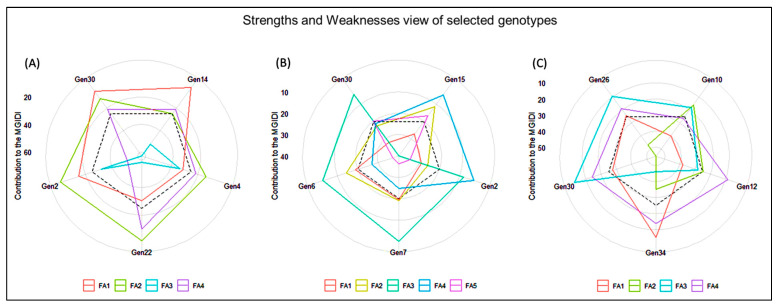
Yield is a complex parameter of rice due to its polygonal nature, sometimes making it difficult to coat the selection process in the breeding program. In the current study, 34 elite rice genotypes were assessed to evaluate 3 locations for the selection of desirable rice cultivars suitable for multiple environments based on genetic diversity. In variance analysis, all genotypes have revealed significant variations (p ≤ 0.001) for all studied characters, signifying a broader sense of genetic variability for selection purposes. The higher phenotypic coefficient of variation (PCV) and genotypic coefficient of variation (GCV) were found for yield-associated characteristics such as the number of grains panicle-1 (GP), panicles hill-1 (PPH), and tillers hill-1 (TILL). All of the characters had higher heritability (greater than 60%) and higher genetic advance (greater than 20%), which pointed out non-additive gene action and suggested that selection would be effective. The most significant traits causing the genotype variants were identified via principal component analysis. In the findings of the cluster analysis, 34 elite lines were separated into 3 categories of clusters, with cluster II being chosen as the best one. The relationship matrix between each elite cultivar and traits was also determined utilizing a heatmap. Based on multi-trait genotype-ideotype distance index (MGIDI), genotypes Gen2, Gen4, Gen14, Gen22, and Gen30 in Satkhira; Gen2, Gen6, Gen7, Gen15, and Gen30 in Kushtia; and Gen10, Gen12, Gen26, Gen30, and Gen34 in Barishal were found to be the most promising genotypes. Upon validation, these genotypes can be suggested for commercial release or used as potential breeding material in crossing programs for the development of cultivars suitable for multiple environments under the future changing climate.
Keywords: MGIDI; clustered heatmap; genetic diversity; principal component analysis; trait association.
Conflict of interest statement
The authors declare no conflict of interest.
Figures
References
-
- BBS . Bangladesh Bureau of Statistics. Statistics and Informatics Division (SID), Ministry of Planning, Government of the People’s Republic of Bangladesh; Dhaka, Bangladesh: 2017. Yearbook of Agricultural Statistics; p. 42.
-
- BBS . Bangladesh Bureau of Statistics. Statistics and Informatics Division (SID), Ministry of Planning, Government of the People’s Republic of Bangladesh; Dhaka, Bangladesh: 2020. Yearbook of Agricultural Statistics; p. 39.
-
- Brolley M. Rice Today. International Rice Research Institute (IRRI); Metro Manila, Philippines: 2015. Rice security is food security for much of the world; pp. 30–32.
-
- Nath N.C. Food security in Bangladesh: Status, challenges and strategic policy options; Proceedings of the 19th Biennial Conference of the Bangladesh Economic Association (BAE); Dhaka, Bangladesh. 8–10 January 2015.
-
- Kabir M.S., Salam M.U., Chowdhury A., Rahman N.M.F., Iftekharuddaula K.M., Rahman M.S., Rashid M.H., Dipti S.S., Islam A., Latif M.A., et al. Rice vision for Bangladesh: 2050 and beyond. Bangladesh Rice J. 2015;19:1–18. doi: 10.3329/brj.v19i2.28160. - DOI
Publication types
MeSH terms
LinkOut - more resources
Full Text Sources
