Evaluation of Transport Properties and Energy Conversion of Bacterial Cellulose Membrane Using Peusner Network Thermodynamics
- PMID: 36673144
- PMCID: PMC9858365
- DOI: 10.3390/e25010003
Evaluation of Transport Properties and Energy Conversion of Bacterial Cellulose Membrane Using Peusner Network Thermodynamics
Abstract
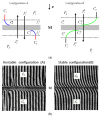
We evaluated the transport properties of a bacterial cellulose (BC) membrane for aqueous ethanol solutions. Using the Rr version of the Kedem-Katchalsky-Peusner formalism (KKP) for the concentration polarization (CP) conditions of solutions, the osmotic and diffusion fluxes as well as the membrane transport parameters were determined, such as the hydraulic permeability (Lp), reflection (σ), and solute permeability (ω). We used these parameters and the Peusner (Rijr) coefficients resulting from the KKP equations to assess the transport properties of the membrane based on the calculated dependence of the concentration coefficients: the resistance, coupling, and energy conversion efficiency for aqueous ethanol solutions. The transport properties of the membrane depended on the hydrodynamic conditions of the osmotic diffusion transport. The resistance coefficients R11r, R22r, and Rdetr were positive and higher, and the R12r coefficient was negative and lower under CP conditions (higher in convective than nonconvective states). The energy conversion was evaluated and fluxes were calculated for the U-, F-, and S-energy. It was found that the energy conversion was greater and the S-energy and F-energy were lower under CP conditions. The convection effect was negative, which means that convection movements were directed vertically upwards. Understanding the membrane transport properties and mechanisms could help to develop and improve the membrane technologies and techniques used in medicine and in water and wastewater treatment processes.
Keywords: Kedem–Katchalsky–Peusner equations; Peusner coefficients of membranes; bacterial cellulose membrane; concentration polarization; energy conversion; membrane transport.
Conflict of interest statement
The authors declare no conflict of interest.
Figures


Similar articles
-
L version of the transformed Kedem-Katchalsky equations for membrane transport of electrolyte solutions and internal energy conversion.Polim Med. 2024 Jan-Jun;54(1):45-57. doi: 10.17219/pim/175949. Polim Med. 2024. PMID: 38315071
-
Evaluation of transport properties of biomembranes by means of Peusner network thermodynamics.Acta Bioeng Biomech. 2021;23(2):63-72. Acta Bioeng Biomech. 2021. PMID: 34846049
-
R Version of the Kedem-Katchalsky-Peusner Equations for Liquid Interface Potentials in a Membrane System.Entropy (Basel). 2025 Feb 6;27(2):169. doi: 10.3390/e27020169. Entropy (Basel). 2025. PMID: 40003166 Free PMC article.
-
Membrane permeability modeling: Kedem-Katchalsky vs a two-parameter formalism.Cryobiology. 1998 Dec;37(4):271-89. doi: 10.1006/cryo.1998.2135. Cryobiology. 1998. PMID: 9917344 Review.
-
The use of linear nonequilibrium thermodynamics in the study of renal physiology.Am J Physiol. 1979 Mar;236(3):F211-9. doi: 10.1152/ajprenal.1979.236.3.F211. Am J Physiol. 1979. PMID: 371416 Review.
References
-
- Baker R. Membrane Technology and Application. John Wiley & Sons; New York, NY, USA: 2012.
-
- Savencu I., Iurian S., Porfire A., Bogdan C., Tomuță I. Review of advances in polymeric wound dressing films. React. Funct. Polym. 2021;168:105059. doi: 10.1016/j.reactfunctpolym.2021.105059. - DOI
-
- Demirel Y. Nonequilibrium Thermodynamics: Transport and Rate Processes in Physical, Chemical and Biological Systems. Elsevier; Amsterdam, The Netherlands: 2014.
-
- Lipton B. The Biology of Belief: Unleashing the Power of Consciousness. Hay House; Carlsbad, CA, USA: 2018. ISBN-10: 1401923127.
LinkOut - more resources
Full Text Sources
Miscellaneous

