. 2023 Jan 16;20(2):1617.
doi: 10.3390/ijerph20021617.

Development and Assessment of a Novel Core Biopsy-Based Prediction Model for Pathological Complete Response to Neoadjuvant Chemotherapy in Women with Breast Cancer

Affiliations

Development and Assessment of a Novel Core Biopsy-Based Prediction Model for Pathological Complete Response to Neoadjuvant Chemotherapy in Women with Breast Cancer

Ailin Lan et al. Int J Environ Res Public Health. .

Abstract

Purpose: Pathological complete response (pCR), the goal of NAC, is considered a surrogate for favorable outcomes in breast cancer (BC) patients administrated neoadjuvant chemotherapy (NAC). This study aimed to develop and assess a novel nomogram model for predicting the probability of pCR based on the core biopsy. Methods: This was a retrospective study involving 920 BC patients administered NAC between January 2012 and December 2018. The patients were divided into a primary cohort (769 patients from January 2012 to December 2017) and a validation cohort (151 patients from January 2017 to December 2018). After converting continuous variables to categorical variables, variables entering the model were sequentially identified via univariate analysis, a multicollinearity test, and binary logistic regression analysis, and then, a nomogram model was developed. The performance of the model was assessed concerning its discrimination, accuracy, and clinical utility. Results: The optimal predictive threshold for estrogen receptor (ER), Ki67, and p53 were 22.5%, 32.5%, and 37.5%, respectively (all p < 0.001). Five variables were selected to develop the model: clinical T staging (cT), clinical nodal (cN) status, ER status, Ki67 status, and p53 status (all p ≤ 0.001). The nomogram showed good discrimination with the area under the curve (AUC) of 0.804 and 0.774 for the primary and validation cohorts, respectively, and good calibration. Decision curve analysis (DCA) showed that the model had practical clinical value. Conclusions: This study constructed a novel nomogram model based on cT, cN, ER status, Ki67 status, and p53 status, which could be applied to personalize the prediction of pCR in BC patients treated with NAC.

Keywords: breast cancer; neoadjuvant chemotherapy; nomogram; pathological complete response; prediction model.


Conflict of interest statement

The authors declare that the research was conducted with no commercial or financial relationships that could be construed as potential conflicts of interest.

Figures

Figure 1
Figure 1
Flow chart of (A) patient selection; (B) statistical process. Abbreviations: BC, breast cancer; NAC, neoadjuvant chemotherapy; HER2, human epidermal growth factor receptor 2; ER, estrogen receptor; ROC, receiver operating characteristic; AUC, area under the curve.
Figure 2
Figure 2
ROC analysis showing the best discriminative value to predict pCR for (A) ER; (B) PR; (C) Ki67; (D) p53 in the primary cohort. Abbreviations: ROC, receiver operating characteristic; AUC, area under the curve; CI, confidence intervals; ER, estrogen receptor; PR, progesterone receptor.
Figure 3
Figure 3
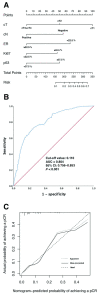
(A) Predicting the probability of pCR in the nomogram. (B) ROC curves for the nomogram model to predict the probability of achieving pCR in the primary cohort. (C) Calibration curves for the nomogram model predicting the probability of achieving pCR in the primary cohort. Abbreviations: pCR, pathological complete response; cT, clinical T staging; cN, clinical nodal status; ER, estrogen receptor; ROC, receiver operating characteristic; AUC, area under the curve; CI, confidence intervals.
Figure 4
Figure 4
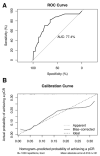
(A) ROC curves for the nomogram model to predict the probability of achieving pCR in the validation cohort. (B) Calibration curves for the nomogram model predicting the probability of achieving pCR in the validation cohort. Abbreviations: ROC, receiver operating characteristic; pCR pathological complete response; AUC, area under the curve.
Figure 5
Figure 5
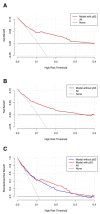
DCA of the (A) model with p53; (B) without p53. (C) Comparison between the models with and without p53. Abbreviations: DCA, decision curve analysis.
Figure 6
Figure 6
The clinical impact curves of the nomogram prediction model.

References

    1. Sung H., Ferlay J., Siegel R.L., Laversanne M., Soerjomataram I., Jemal A., Bray F. Global Cancer Statistics 2020: GLOBOCAN Estimates of Incidence and Mortality Worldwide for 36 Cancers in 185 Countries. CA Cancer J. Clin. 2021;71:209–249. doi: 10.3322/caac.21660. - DOI - PubMed
    1. Harbeck N., Gnant M. Breast cancer. Lancet. 2017;389:1134–1150. doi: 10.1016/S0140-6736(16)31891-8. - DOI - PubMed
    1. Kruiswijk F., Labuschagne C.F., Vousden K.H. p53 in survival, death and metabolic health: A lifeguard with a licence to kill. Nat. Rev. Mol. Cell Biol. 2015;16:393–405. doi: 10.1038/nrm4007. - DOI - PubMed
    1. Williams C., Norberg T., Ahmadian A., Pontén F., Bergh J., Inganäs M., Lundeberg J., Uhlén M. Assessment of sequence-based p53 gene analysis in human breast cancer: Messenger RNA in comparison with genomic DNA targets. Clin. Chem. 1998;44:455–462. doi: 10.1093/clinchem/44.3.455. - DOI - PubMed
    1. Hassin O., Oren M. Drugging p53 in cancer: One protein, many targets. Nat. Rev. Drug Discov. 2022:1–18. doi: 10.1038/s41573-022-00571-8. - DOI - PMC - PubMed

Publication types