. 2023 Jan 4;24(2):955.
doi: 10.3390/ijms24020955.

Experimental and Bioinformatic Insights into the Effects of Epileptogenic Variants on the Function and Trafficking of the GABA Transporter GAT-1

Affiliations

Experimental and Bioinformatic Insights into the Effects of Epileptogenic Variants on the Function and Trafficking of the GABA Transporter GAT-1

Dolores Piniella et al. Int J Mol Sci. .

Abstract

In this article, we identified a novel epileptogenic variant (G307R) of the gene SLC6A1, which encodes the GABA transporter GAT-1. Our main goal was to investigate the pathogenic mechanisms of this variant, located near the neurotransmitter permeation pathway, and compare it with other variants located either in the permeation pathway or close to the lipid bilayer. The mutants G307R and A334P, close to the gates of the transporter, could be glycosylated with variable efficiency and reached the membrane, albeit inactive. Mutants located in the center of the permeation pathway (G297R) or close to the lipid bilayer (A128V, G550R) were retained in the endoplasmic reticulum. Applying an Elastic Network Model, to these and to other previously characterized variants, we found that G307R and A334P significantly perturb the structure and dynamics of the intracellular gate, which can explain their reduced activity, while for A228V and G362R, the reduced translocation to the membrane quantitatively accounts for the reduced activity. The addition of a chemical chaperone (4-phenylbutyric acid, PBA), which improves protein folding, increased the activity of GAT-1WT, as well as most of the assayed variants, including G307R, suggesting that PBA might also assist the conformational changes occurring during the alternative access transport cycle.

Keywords: 4-phenylbutyrate; GABA transporter; epilepsy; intracellular trafficking.


Conflict of interest statement

The authors declare no conflict of interest.

Figures
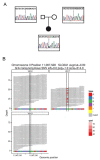
Figure 1
Figure 1
(A) Pedigree and Sanger sequencing of the family 1 trio. (B). Integrated genomics viewer (IGV) screenshot from WES coverage data of point mutation c.919G>A (p.Gly307Arg) in trio family from patient 1 (genomic location chr3:11067528; V817 index case; V818 father; V819 mother).
Figure 2
Figure 2
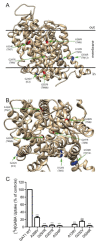
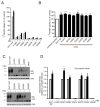
Effect of GAT-1 mutations on its activity. (A,B) Lateral (A) and top (B) view of the ribbon diagram of GAT-1 (PDB: 7sk2) indicating the location of the variants studied in this article. Peripheral mutations are indicated in blue, and those located within the permeation pathway in red. The position of the membrane is indicated in the lateral view by two black lines. (C) GABA uptake activity measured in transfected HEK293 cells. Cells were transfected and 48 h later were incubated for 10 min in the presence of 0.1 µCi of [3H]GABA, and the incorporated radioactivity was determined in a scintillation counter. Values represent the percentage of the activity observed in the wild-type control (GAT-1 WT) after correction for the background observed in mock-transfected cells. Values are the means ± SEM of three experiments. Average CPM values per well were 5387 for the controls and 254 for the mock-transfected cells. Values are the mean ± SEM of four experiments. ***: p < 0.001, paired t-test.
Figure 3
Figure 3
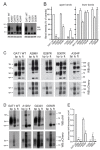
Expression of GAT-1 variants in transfected HEK293 cells. (A). HEK293 cells were transfected with the indicated variants of GAT-1 as indicated in Figure 2. Cell were lysated and samples were analyzed by western blot using anti-HA antibody and anti-calnexin as a loading control. (B). Densitometric analysis of the fully (upper) and the core glycosylated (lower) bands expressed as percentage of the GAT-1 WT variant. Values are the mean ± SEM of four experiments. *: p < 0.01; **: p < 0.005; ***: p < 0.001, paired t-test. (C,D). Biotinylation assay. HEK293 cells were co-transfected with mCherry-DAT plus either GAT-1 WT (control) or the indicated variants. Two days later, cell surface proteins were labeled with sulfo-NHS-biotin. Biotinylated proteins were separated from non-biotinylated ones with streptavidin-agarose beads and eluted from the beads. Samples of biotinylated protein (bp), lysate (ly) and flow through (ft) were resolved by SDS-PAGE and analyzed by immunoblotting with anti-HA antibodies, and reprobed with anti-mCherry antibodies. The different bands correspond to core glycosylated protein, either monomeric or aggregated (cgm and cga), and fully glycosylated protein (fgm, fga). (E) Histograms corresponding to densitometric analysis of biotinylated proteins. Values correspond to the ratio between the densitometric adjusted volumes for the biotinylated bands of HA-GAT-1 (monomers plus aggregated proteins) divided by the biotinylated band for mCherry-DAT (monomers). Values represent the mean ± SEM of four experiments after normalization to the ratio obtained for the controls (GAT-1 WT). **: p < 0.005; ***: p < 0.001, paired t-test.
Figure 4
Figure 4
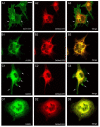
Subcellular distribution of GAT-1 variants in transfected cells. COS7 cells were transfected with expression vectors for HA-GAT-1 WT (A1A3) or the indicated HA-tagged mutants: A128V (B1B3); G232V (C1C3); G288V (D1D3). Transfection mixture also contained the expression vector for the fluorescent protein DsRed2-ER, which localized to the ER. Two days later, cells were fixed with 4% paraformaldehyde, immunostained with anti-HA plus anti-mCherry antibodies, and analyzed by confocal microscopy. Note the presence of membrane sheets in some cells (arrows), although in some cases (G232V) they are very faint. Scale bar: 15 µm.
Figure 5
Figure 5
Subcellular distribution of GAT-1 variants in transfected cells. COS7 cells were transfected with expression vectors for the indicated HA-tagged mutants: G297R (A1A3); G307R (B1B3); A334P (C1C3); G550R (D1D3). Transfection mixture also contained the expression vector for the fluorescent protein DsRed2-ER, which localized to the ER. Two days later, cells were fixed with 4% paraformaldehyde, immunostained with anti-HA plus anti-mCherry antibodies and analyzed by confocal microscopy. Note the presence of membrane sheets in some cells (arrows), although in some cases (A334P) they are very faint. Scale bar: 15 µm.
Figure 6
Figure 6
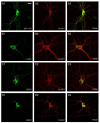
Subcellular distribution of GAT-1 variants in transfected neurons. Primary cultures of rat cortical neurons were co-transfected at 13 DIV with mCherry-DAT plus the indicated variants of HA-GAT-1: HA-GAT1 WT (A1A3); A128V (B1B3); G232V (C1C3); G288V (D1D3). 48 h later, cells were fixed and incubated with anti-HA and anti-mCherry primary antibodies followed by Alexa Fluor-labeled secondary antibodies. Images collected by confocal microscopy correspond to the distribution of HA-GAT-1 variants (green channel; A1,B1,C1,D1), mCherry-DAT (red channel; A2,B2,C2,D2) or the merge (A3,B3,C3,D3). Scale bar: 15 µm.
Figure 7
Figure 7
Subcellular distribution of GAT-1 variants in transfected neurons. Primary cultures of rat cortical neurons were co-transfected at 13 DIV with mCherry-DAT plus the indicated variants of HA-GAT-1: G297R (A1A3); G307R (B1B3); A334P (C1C3); G550R (D1D3). 48 h later, cells were fixed and incubated with anti-HA and anti-mCherry primary antibodies followed by Alexa-labeled secondary antibodies. Images collected by confocal microscopy correspond to distribution of HA-GAT-1 variants (green channel; A1,B1,C1,D1), mCherry-DAT (red channel; A2,B2,C2,D2) or the merge (A3,B3,C3,D3). Scale bar: 15 µm.
Figure 8
Figure 8
Directionality coupling (A), coordination coupling (B) and deformation coupling (C) between three pairs of functional sites (horizontal axis): extracellular gate with tiagabine binding site (TGI) (first bar), intracellular gate with TGI (second bar) and intracellular gate with extracellular gate (third bar). The couplings are calculated with PDB:7sk2, which is an inward-open conformation in complex with the inhibitor tiagabine. Note that the TGI, which is thought to overlap the GABA binding site, is strongly co-directional and coordinated with the extracellular gate, but has low co-directionality and coordination with the intracellular gate. On the contrary, the TGI and the intracellular gate can strongly perturb each other (C).
Figure 9
Figure 9
Directionality coupling (AC) and coordination coupling (DF) between the 16 mutated sites (horizontal axis) and three functional sites of GAT-1: the tiagabine binding site (TGI) (first column, A,D), the extracellular gate (second column, B,E) and the intracellular gate (third column, C,F). Mutants are shown in three groups separated by dashed lines: pathogenic mutants that prejudice transport to the membrane (m1); pathogenic mutants that do not prejudice transport to the membrane (m2); and non-pathogenic mutants (m3). Note that most sites are positively co-directional and strongly coordinated with the tiagabine binding site, which is thought to overlap the GABA binding site.
Figure 10
Figure 10
Deformation coupling between the 16 mutated sites (horizontal axis) and three functional sites: the tiagabine binding site (TGI) (A), the extracellular gate (B) and the intracellular gate (C). (D,E) Predicted structural effect of specified mutations on the global structure of the protein, assessed in terms of predicted RMSD between the native structure of the wild-type and the mutant (D), and predicted harmonic energy barrier ΔE between the two structures (E), which informs of the accessibility of the native structure of the WT in the native protein. The mutants are shown in three groups separated by dashed lines: pathogenic mutants that prejudice transport to the membrane (m1); pathogenic mutants that do not prejudice transport to the membrane (m2); and non-pathogenic mutants (m3).
Figure 11
Figure 11
Effect of 4-phenylbutyrate on the activity and expression levels of GAT-1. (A). HEK293 cells were transfected with 0.5 µg of the expression vectors for the indicated variants of GAT-1, and 24 h later were treated with 2 mM PBA for 24 additional hours. Then, cells were incubated for 10 min in the presence of 0.1 µCi of [3H]GABA and the incorporated radioactivity was determined in a scintillation counter. Values represent the percentage of the activity observed in the controls (GAT-1 WT) after correction for the background observed in mock-transfected cells and represent the mean ± SEM of three triplicate experiments. **: p < 0.005; ***: p < 0.001, paired t-test. (B). HEK293 cells were transfected with 0.25 µg of the expression vectors for the indicated variants of HA-GAT-1 plus 0.25 µg of HA-GAT-1 WT. Uptake assays were performed and processed as indicated in (A). (C). Samples of transfected cells were analyzed by western blot using anti-HA antibody and reprobed with anti-calnexin. (D). The intensity of the mature glycosylated band was measured by densitometry. Values represent the mean ± SEM of four experiments after normalization to the ratio obtained for the untreated controls. *: p < 0.01, paired t-test.

References

    1. Carvill G.L., McMahon J.M., Schneider A., Zemel M., Myers C.T., Saykally J., Nguyen J., Robbiano A., Zara F., Specchio N., et al. Mutations in the GABA Transporter SLC6A1 Cause Epilepsy with Myoclonic-Atonic Seizures. Am. J. Hum. Genet. 2015;96:808–815. doi: 10.1016/j.ajhg.2015.02.016. - DOI - PMC - PubMed
    1. Johannesen K.M., Gardella E., Linnankivi T., Courage C., de Saint Martin A., Lehesjoki A.-E., Mignot C., Afenjar A., Lesca G., Abi-Warde M.-T., et al. Defining the Phenotypic Spectrum of SLC6A1 Mutations. Epilepsia. 2018;59:389–402. doi: 10.1111/epi.13986. - DOI - PMC - PubMed
    1. Fischer F.P., Kasture A.S., Hummel T., Sucic S. Molecular and Clinical Repercussions of GABA Transporter 1 Variants Gone Amiss: Links to Epilepsy and Developmental Spectrum Disorders. Front. Mol. Biosci. 2022;9:834498. doi: 10.3389/fmolb.2022.834498. - DOI - PMC - PubMed
    1. Farhan H., Korkhov V.M., Paulitschke V., Dorostkar M.M., Scholze P., Kudlacek O., Freissmuth M., Sitte H.H. Two Discontinuous Segments in the Carboxyl Terminus Are Required for Membrane Targeting of the Rat Gamma-Aminobutyric Acid Transporter-1 (GAT1) J. Biol. Chem. 2004;279:28553–28563. doi: 10.1074/jbc.M307325200. - DOI - PubMed
    1. Imoukhuede P.I., Moss F.J., Michael D.J., Chow R.H., Lester H.A. Ezrin Mediates Tethering of the Gamma-Aminobutyric Acid Transporter GAT1 to Actin Filaments via a C-Terminal PDZ-Interacting Domain. Biophys. J. 2009;96:2949–2960. doi: 10.1016/j.bpj.2008.11.070. - DOI - PMC - PubMed

MeSH terms

Substances

LinkOut - more resources