. 2023 Jan 4;24(2):978.
doi: 10.3390/ijms24020978.

IGFL2-AS1, a Long Non-Coding RNA, Is Associated with Radioresistance in Colorectal Cancer

Affiliations

IGFL2-AS1, a Long Non-Coding RNA, Is Associated with Radioresistance in Colorectal Cancer

Jeeyong Lee et al. Int J Mol Sci. .

Abstract

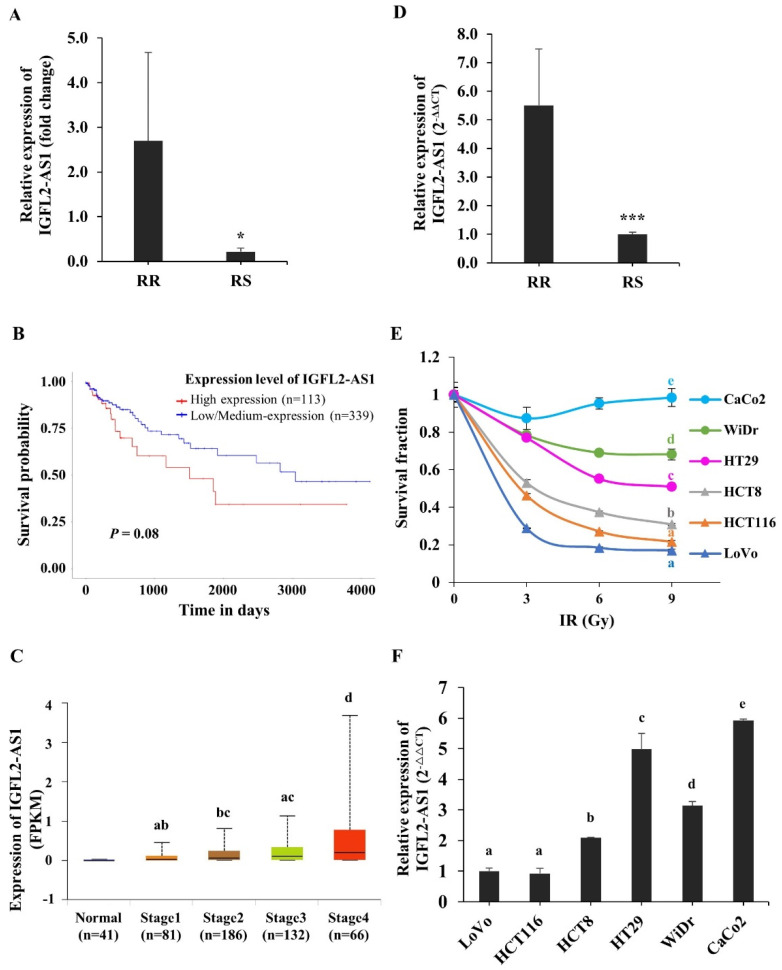
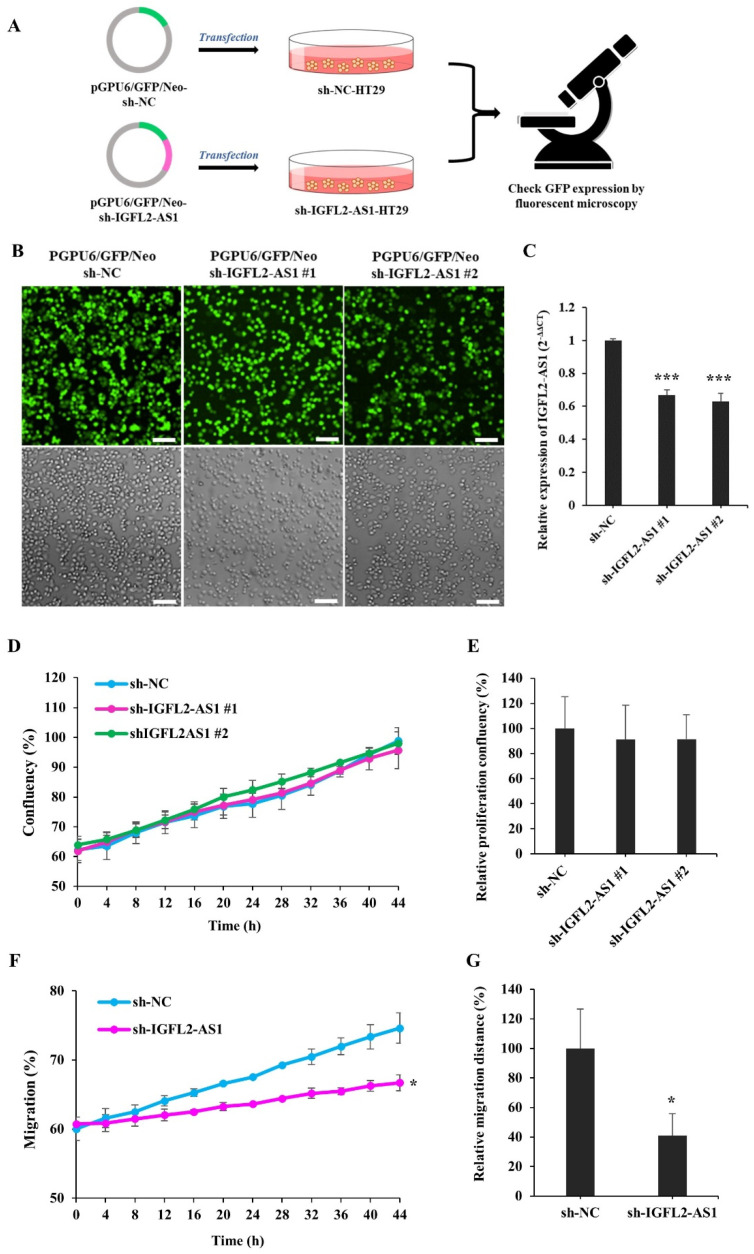
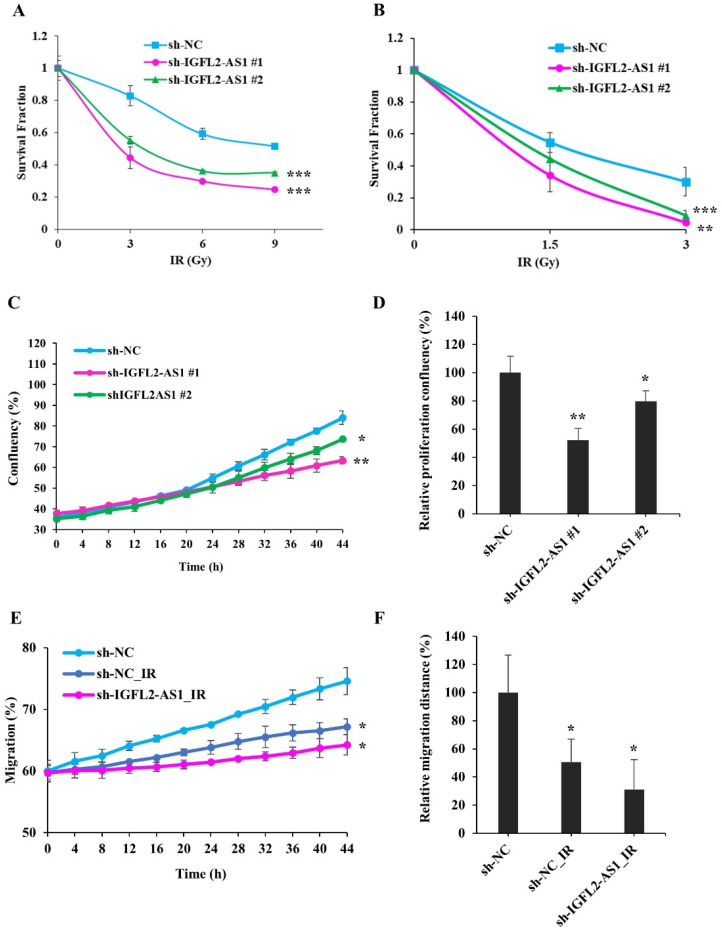
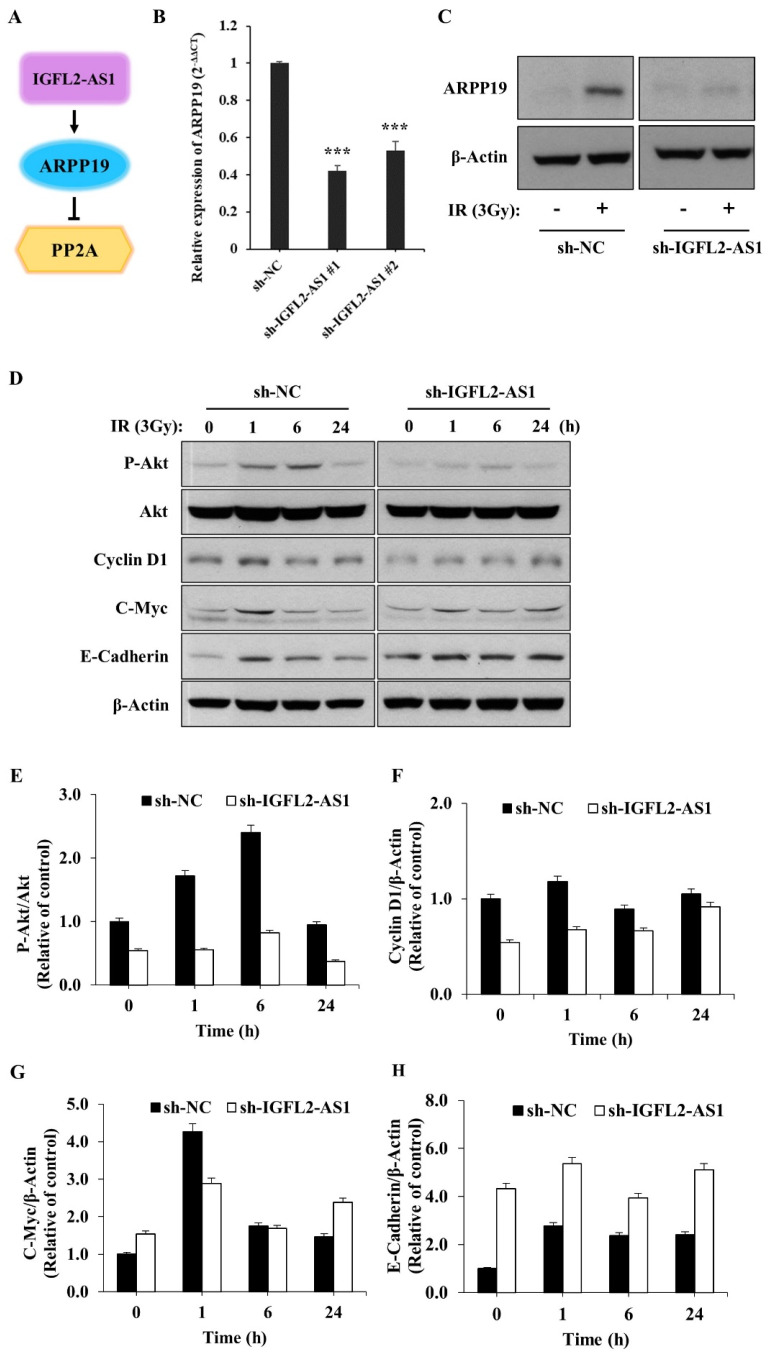
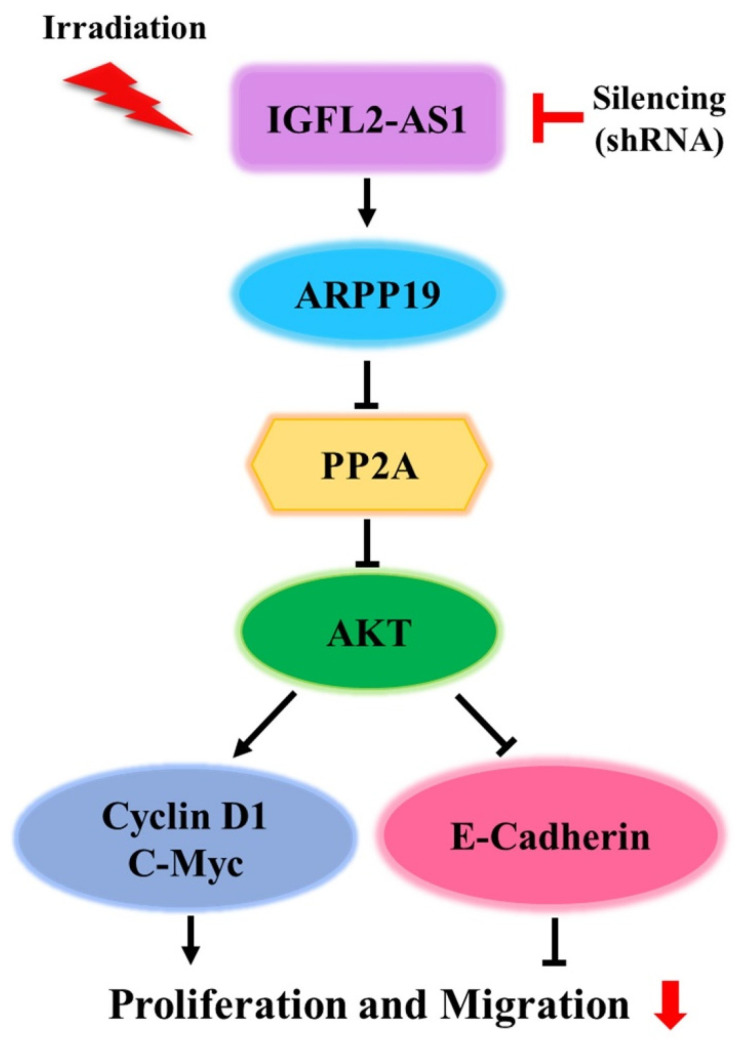
Precise prediction of radioresistance is an important factor in the treatment of colorectal cancer (CRC). To discover genes that regulate the radioresistance of CRCs, we analyzed an RNA sequencing dataset of patient-originated samples. Among various candidates, IGFL2-AS1, a long non-coding RNA (lncRNA), exhibited an expression pattern that was well correlated with radioresistance. IGFL2-AS1 is known to be highly expressed in various cancers and functions as a competing endogenous RNA. To further investigate the role of IGFL2-AS1 in radioresistance, which has not yet been studied, we assessed the amount of IGFL2-AS1 transcripts in CRC cell lines with varying degrees of radioresistance. This analysis showed that the more radioresistant the cell line, the higher the level of IGFL2-AS1 transcripts-a similar trend was observed in CRC samples. To directly assess the relationship between IGFL2-AS1 and radioresistance, we generated a CRC cell line stably expressing a small hairpin RNA (shRNA) targeting IGFL2-AS1. shRNA-mediated knockdown of IGFL2-AS1 decreased radioresistance and cell migration in vitro, establishing a functional role for IGFL2-AS1 in radioresistance. We also showed that downstream effectors of the AKT pathway played crucial roles. These data suggest that IGFL2-AS1 contributes to the acquisition of radioresistance by regulating the AKT pathway.

Keywords: AKT; IGFL2-AS1; biomarker; long non-coding RNA; radioresistance.


Conflict of interest statement

The authors declare no conflict of interest. The funders had no role in the design of the study; in the collection, analyses, or interpretation of data; in the writing of the manuscript; or in the decision to publish the results.

Figures

Figure 1
Figure 1
Identification of IGFL2-AS1 as a candidate regulator of radioresistance in CRC. (A) IGFL2-AS1 levels in a CRC patient RNA-seq dataset. The graph depicts the degree of differential expression of IGFL2-AS1 transcripts between radioresistant (RR) and radiosensitive (RS) patient-originated samples. (B) Survival analysis of IGFL2-AS1 expression in colon adenocarcinoma. The results based on the UALCAN database indicated that higher expression of IGFL2-AS1 was associated with poor prognosis in colon adenocarcinoma (p = 0.08). (C) Relationship between IGFL2-AS1 expression and individual cancer stages of patients with colon adenocarcinoma in UALCAN database. (D) The relative level of IGFL2-AS1 transcripts in the patient-originated samples, measured using qRT-PCR. (E) Viability of CRC cell lines after irradiation with doses of 0, 3, 6, and 9 Gy (n = 3 independent experiments), measured by MTT assay. Survival fractions were assessed 3 days after irradiation. Data are normalized to those of non-irradiated controls. (F) The relative level of IGFL2-AS1 transcripts, measured using qRT-PCR. The graph depicts the degree of differential expression of IGFL2-AS1 transcripts between CRC cell lines. Data are normalized to those of the LoVo cell line. Data are presented as means ± SD. Student’s t-test (C) and one-way ANOVA with Tukey post-hoc tests (E,F) were performed. Different letters on top represent statistically significant results (p < 0.05), whereas the same letters indicate no statistically significant differences. Asterisk indicates the followings: * p < 0.05, *** p < 0.001.
Figure 2
Figure 2
Generation and characterization of a CRC cell line stably transfected with sh-IGFL2-AS1. (A) Schematic depicting the establishment of stable cell lines. HT29 cells were transfected with the shRNA-expressing plasmids, pGPU6/GFP/Neo-sh-NC (sh-NC) and pGPU6/GFP/Neo-sh-IGFL2- AS1 (sh-IGFL2-AS1). After incubating transfected HT29 cells with G418 for 2 weeks, individual colonies were isolated. (B) GFP fluorescence (upper panels) and brightfield (lower panels) images of the indicated cell lines are shown. Scale bar: 400 μm. (C) The relative level of IGFL2-AS1 transcripts, measured using qRT-PCR. The graph depicts IGFL2-AS1 transcript levels in the indicated cell lines. Data are normalized to those of the sh-NC-HT29 cell line. (D) Proliferation rates of the indicated cell lines, measured using a Celloger Mini Plus time-lapse microscopy system. The graph shows proliferation rates calculated from digital images acquired from the same field over 48 h. (E) Graph showing the proliferation rates of the indicated cell lines after monitoring for 48 h. (F) Wound-healing assays performed using the indicated cell lines. The scratched area was monitored using a time-lapse microscope. The graph shows the rate of cell migration measured over a period of 48 h. (G) Graph showing wound-healing assays for the indicated cell lines, monitored after 48 h. Data are presented as means ± SD. Asterisk indicates the followings: * p < 0.05, *** p < 0.001.
Figure 3
Figure 3
Radiation sensitivity is enhanced in IGFL2-AS1–knockdown CRC cell lines. (A) Viability of the indicated cell lines after irradiating with doses of 0, 3, 6, and 9 Gy, measured by MTT assay. Survival fractions were assessed 3 days after irradiation. Data are normalized to those of non-irradiated controls. (B) Colony formations after irradiating with doses of 0, 1.5, 3, Gy, measured by clonogenic assay. Colonies containing more than 50 cells were assessed 14 days after irradiation. Data were normalized to those of non-irradiated controls and the results are expressed as surviving fraction. (C) Proliferation rates of the indicated cell lines following exposure to 3 Gy irradiation (at 0 h). Digital images from the same field were acquired using a Celloger Mini Plus time-lapse microscopy system. The graph shows proliferation rates calculated over a 48-h period. (D) Graph showing proliferation rates of the indicated cell lines over a 48-h period after irradiation at a dose of 3 Gy (at 0 h). (E) Wound-healing assays performed using the indicated cell lines. Cells were irradiated at a dose of 3 Gy irradiation (at 0 h), and the scratched area was subsequently monitored for migrated cells using time-lapse microscopy. (F) Graph showing the rate of cell migration, measured over a period of 48 h after wounding and/or irradiating (at 0 h). Data are presented as means ± SD. Asterisk indicates the followings: * p < 0.05, ** p < 0.01, *** p < 0.001.
Figure 4
Figure 4
AKT pathway signaling is suppressed by sh-IGFL2-AS1. (A) Schematic depicting the IGFL2-AS1 pathway. (B) Relative transcription of ARPP19, measured using qRT PCR. The graph depicts the levels of ARPP19 in the indicated cell lines. Data are normalized to those of the sh-NC-HT29 cell line; error bars indicate SDs. *** p < 0.001. (C) Protein expression of ARPP19, measured by western blotting. The expression of β-actin was used as a loading control. (D) Western blot analyses of various proteins downstream of AKT. Cells incubated as indicated after irradiation (3 Gy) were lysed and analyzed by western blotting; β-actin was used as a loading control. (EH) Densitometric measurements of protein expressions, corresponding to (D). The results are presented as the ratio of phosphor-AKT/AKT (E), cyclin D1/β-actin (F), c-Myc/β-actin (G), and E-cadherin/β-actin (H).
Figure 5
Figure 5
Schematic depiction of the sh-IGFL2-AS1 regulatory pathway. The current model of the association of IGFL2-AS1 with the acquisition of radioresistance in CRC.

References

    1. Araghi M., Soerjomataram I., Jenkins M., Brierley J., Morris E., Bray F., Arnold M. Global trends in colorectal cancer mortality: Projections to the year 2035. Int. J. Cancer. 2019;144:2992–3000. doi: 10.1002/ijc.32055. - DOI - PubMed
    1. Lee J., Kwon J., Kim D., Park M., Kim K., Bae I., Kim H., Kong J., Kim Y., Shin U., et al. Gene Expression Profiles Associated with Radio-Responsiveness in Locally Advanced Rectal Cancer. Biology. 2021;10:500. doi: 10.3390/biology10060500. - DOI - PMC - PubMed
    1. Panni S., Lovering R.C., Porras P., Orchard S. Non-coding RNA regulatory networks. Biochim. Biophys. Acta-Gene Regul. Mech. 2020;1863:194417. doi: 10.1016/j.bbagrm.2019.194417. - DOI - PubMed
    1. Zhang D., Xiong M., Xu C., Xiang P., Zhong X. Long Noncoding RNAs: An Overview. Methods Mol. Biol. 2016;1402:287–295. doi: 10.1007/978-1-4939-3378-5_22. - DOI - PubMed
    1. Cheng G., Liu D., Liang H., Yang H., Chen K., Zhang X. A cluster of long non-coding RNAs exhibit diagnostic and prognostic values in renal cell carcinoma. Aging. 2019;11:9597–9615. doi: 10.18632/aging.102407. - DOI - PMC - PubMed

MeSH terms