. 2023 Jan 5;24(2):1029.
doi: 10.3390/ijms24021029.

Evaluation of Oxidative Stress and Metabolic Profile in a Preclinical Kidney Transplantation Model According to Different Preservation Modalities

Affiliations

Evaluation of Oxidative Stress and Metabolic Profile in a Preclinical Kidney Transplantation Model According to Different Preservation Modalities

Mrakic-Sposta Simona et al. Int J Mol Sci. .

Abstract

This study addresses a joint nuclear magnetic resonance (NMR) and electron paramagnetic resonance (EPR) spectroscopy approach to provide a platform for dynamic assessment of kidney viability and metabolism. On porcine kidney models, ROS production, oxidative damage kinetics, and metabolic changes occurring both during the period between organ retrieval and implantation and after kidney graft were examined. The 1H-NMR metabolic profile—valine, alanine, acetate, trimetylamine-N-oxide, glutathione, lactate, and the EPR oxidative stress—resulting from ischemia/reperfusion injury after preservation (8 h) by static cold storage (SCS) and ex vivo machine perfusion (HMP) methods were monitored. The functional recovery after transplantation (14 days) was evaluated by serum creatinine (SCr), oxidative stress (ROS), and damage (thiobarbituric-acid-reactive substances and protein carbonyl enzymatic) assessments. At 8 h of preservation storage, a significantly (p < 0.0001) higher ROS production was measured in the SCS vs. HMP group. Significantly higher concentration data (p < 0.05−0.0001) in HMP vs. SCS for all the monitored metabolites were found as well. The HMP group showed a better function recovery. The comparison of the areas under the SCr curves (AUC) returned a significantly smaller (−12.5 %) AUC in the HMP vs. SCS. EPR-ROS concentration (μmol·g−1) from bioptic kidney tissue samples were significantly lower in HMP vs. SCS. The same result was found for the NMR monitored metabolites: lactate: −59.76%, alanine: −43.17%; valine: −58.56%; and TMAO: −77.96%. No changes were observed in either group under light microscopy. In conclusion, a better and more rapid normalization of oxidative stress and functional recovery after transplantation were observed by HMP utilization.

Keywords: 1H-NMR; EPR; ROS; hypothermic machine perfusion; kidney transplant; metabolomic; organ preservation; oxidative damage.


Conflict of interest statement

The authors declare no conflict of interest.

Figures

Figure 1
Figure 1
Static cold storage (SCS, the kidney stored in solution surrounded by crushed ice to keep the temperature between 4 and 0 °C is shown in the photo) and hypothermic machine perfusion (HMP, the kidneys in the machine are shown in the photo) preservation conditions assessed by NMR (A) and EPR (B) instruments. Under the instruments: (left) a typical high field 1HNMR spectrum obtained from the perfusion solution during a SCS or HMP experiment. The main assigned resonances are indicated by arrows: Valine: proximal tubules disfunction; Lactate: global ischemia; Acetate: cortical lesion; and TMAO: medullar lesion. Right: a typical EPR spectrum recorded from the perfusion solution at 37 °C. The triplet signal comes from the reaction of 1-hydroxy-3-carboxymethyl-2,2,5,5-tetramethyl-pyrrolidine spin probe (CMH, EPR silent) to 3-carboxymethyl-2,2,5,5-tetramethyl-pyrrolidinyloxy radical (CM, EPR active). When the signal is sequentially acquired, the ROS production rate can be calculated. Using a stable radical compound, such as 3-Carboxy-2,2,5,5-tetramethyl-1-pyrrolidinyloxy (CP), as a reference, the absolute concentration levels are obtained. The singlet is the signal from oxygen label (O2 sensor).
Figure 2
Figure 2
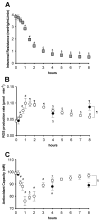
Intra-operative monitoring data. (A) Intra-renal resistance during hypothermic kidney machine perfusion (HMP, mmHg/mL·min); (B) EPR-measured reactive oxygen species production rate (ROS, μmol·min−1); and (C) Antioxidant capacity (TAC, nW) during static cold storage (SCS, full symbols) and hypothermic machine perfusion (HMP, empty symbols). The results are expressed as mean ± SD. Significant differences: * p < 0.05; # p < 0.01, § p < 0.001, and ¶ p < 0.0001.
Figure 3
Figure 3
1H-NMR metabolite concentration (mM) during hypothermic kidney perfusion (HMP, empty symbols) and static cold storage (SCS, full symbols). The rate (mM/h) of the fitted trend resulted as follows: (A) lactate (HMP: K = 0.83, R2 = 0.98; SCS: K = 0.02, R2 = 0.97), (B) trimethylamine N-oxide (TMAO; HMP: K = 0.57, R2 = 0.98; SCS: K = 0.001, R2 = 0.99), (C) valine (HMP: K = 0.78, R2 = 0.99; SCS: K = 0.0005, R2 = 0.95), (D) alanine (HMP: K = 0.55, R2 = 0.98; SCS: K = 0.001, R2 = 0.90), (E) acetate (HMP: K = 0.85, R2 = 0.93; SCS: K = 0.002, R2 = 0.88), and (F) total glutathione (GSH; HMP: K = 0.55, R2 = 0.99; SCS: K = −0.026, R2 = 0.85). The results are expressed as mean ± SD. Significant differences: * p < 0.05; # p < 0.01, § p < 0.001, and ¶ p < 0.0001.
Figure 4
Figure 4
Renal functionality and oxidative stress after kidney re-implantation: (A) Serum creatinine concentration (mg/dL) measured from the HMP (dashed line) and SCS (continuous line) groups and areas under the curves (AUC); (B) Reactive oxygen species production rate (ROS, μmol·min−1) detected by EPR technique; (C) Thiobarbituric-acid-reactive substances (TBARS, μM); and (D) Protein carbonyl (PC, nmol·mg−1 protein) from 1st day to 14th day after kidney transplantation in static cold storage (SCS, full symbols) and hypothermic machine perfusion (HMP, empty symbols) groups. Continuous brackets indicate the significance of the intra-group data with respect to the first day. Blue stars (C) indicate the significance between HMP and SCS data at the same day. The data are expressed as mean ± SD. Significant differences: * p < 0.05; # p < 0.01, § p < 0.001, and ¶ p < 0.0001.
Figure 5
Figure 5
Heat map chart of creatinine levels and oxidative stress biomarkers in plasma: ROS, TBARS, and PC. The correlation coefficient (r) is reported in the squares.
Figure 6
Figure 6
Histogram bars of: (A) ROS concentration (μmol/g) in kidney tissue at different experimental times: T0 (anesthesia), T1 (end of WI, 75min), and T2 (end of perfusion, 8 h) in SCS (full symbols) and HMP (empty symbols) groups. (BE) metabolite concentration (μmol/g) calculated from 1HNMR spectra collected on kidney tissue samples in SCS (full bars) and HMP (empty bars) groups at T0 and T2 experimental times. Significant difference # p < 0.01.
Figure 7
Figure 7
Histological examination. Representative light microscopy images of kidney tissue samples from SCS at T2 (A) and Tend (B) and HMP groups at T2 (C) and Tend (D). Magnification ×100.
Figure 8
Figure 8
Sketch of the experimental protocol adopted to measure ROS production rate by EPR, metabolite concentration changes by 1H-NMR, and oxidative damage during the intra-operative (organ preservation) and post-surgery sessions. The storage solution was sampled at 0 (T1), 4, and 8 h (T2) in SCS and at 0, 15, 30, 45, 60, 90, 120 min, and every hour up to 8 h in HMP. Blood samples were collected every day until the 7th day after re-implantation and at the sacrifice (14th day: Tend). Kidney tissues were biopted after each of the following: anesthesia (T0), 75 min of WI (T1), after 8 h of preservation (T2), and at the 14th day (Tend: sacrifice). WI: warm ischemia; SCS: static cold storage; and HMP: hypothermic machine perfusion.
Figure 9
Figure 9
(A) EPR spectra recorded from both frozen kidney tissue (77 K) and from perfusion solution at 37 °C. The signals come from the reaction of 1-hydroxy-3-carboxymethyl-2,2,5,5-tetramethyl-pyrrolidine spin probe (CMH, EPR silent) to 3-carboxymethyl-2,2,5,5-tetramethyl-pyrrolidinyloxy radical (CM_, EPR active). (B) High-field 1HNMR spectra of (a) perfusate from a machine perfused in Belzer group at the end of the perfusion time (8 h, T2); (b) same expansion from a kidney biopsy at the same time. The correspondent metabolites are indicated by arrows.

References

    1. Wolfe R.A., Ashby V.B., Milford E.L., Ojo A.O., Ettenger R.E., Agodoa L.Y., Held P.J., Port F.K. Comparison of mortality in all patients on dialysis, patients on dialysis awaiting transplantation, and recipients of a first cadaveric transplant. N. Engl. J. Med. 1999;41:1725–1730. doi: 10.1056/NEJM199912023412303. - DOI - PubMed
    1. Tonelli M., Wiebe N., Knoll G., Bello A., Browne S., Jadhav D., Klarenbach S., Gill J. Systematic review: Kidney trans‚Äê plantation compared with dialysis in clinically relevant outcomes. Am. J. Transplant. 2011;11:2093. doi: 10.1111/j.1600-6143.2011.03686.x. - DOI - PubMed
    1. Rana A., Gruessner A., Agopian V.G., Khalpey Z., Riaz I.B., Kaplan B., Halazun K.J., Busuttil R.W., SGruessner R.W.G. Survival benefit of solid-organ transplant in the United States. JAMA Surg. 2015;150:252–259. doi: 10.1001/jamasurg.2014.2038. - DOI - PubMed
    1. Morrissey P.E., Monaco A.P. Donation after circulatory death: Cur- rent practices, ongoing challenges, and potential improvements. Transplantation. 2014;97:258–264. doi: 10.1097/01.TP.0000437178.48174.db. - DOI - PubMed
    1. Rao P.S., Ojo A. The alphabet soup of kidney transplantation: SCD, DCD, ECD–fundamentals for the practicing nephrologist. Clin. J. Am. Soc. Nephrol. 2009;4:1827–1831. doi: 10.2215/CJN.02270409. - DOI - PubMed