. 2023 Jan 5;24(2):1075.
doi: 10.3390/ijms24021075.

ArtinM Cytotoxicity in B Cells Derived from Non-Hodgkin's Lymphoma Depends on Syk and Src Family Kinases

Affiliations

ArtinM Cytotoxicity in B Cells Derived from Non-Hodgkin's Lymphoma Depends on Syk and Src Family Kinases

Bruno Rafael Barboza et al. Int J Mol Sci. .

Abstract

Receptors on the immune cell surface have a variety of glycans that may account for the immunomodulation induced by lectins, which have a carbohydrate recognition domain (CRD) that binds to monosaccharides or oligosaccharides in a specific manner. ArtinM, a D-mannose-binding lectin obtained from Artocarpus heterophyllus, has affinity for the N-glycans core. Immunomodulation by ArtinM toward the Th1 phenotype occurs via its interaction with TLR2/CD14 N-glycans on antigen-presenting cells, as well as recognition of CD3γ N-glycans on murine CD4+ and CD8+ T cells. ArtinM exerts a cytotoxic effect on Jurkat human leukemic T-cell line and human myeloid leukemia cell line (NB4). The current study evaluated the effects of ArtinM on murine and human B cells derived from non-Hodgkin’s lymphoma. We found that murine B cells are recognized by ArtinM via the CRD, and the ArtinM stimulus did not augment the proliferation rate or production of IL-2. However, murine B cell incubation with ArtinM augmented the rate of apoptosis, and this cytotoxic effect of ArtinM was also seen in human B cell-lines sourced from non-Hodgkin’s lymphoma Raji cell line. This cytotoxic effect was inhibited by the phosphatase activity of CD45 on Lck, and the protein kinases of the Src family contribute to cell death triggered by ArtinM.

Keywords: ArtinM; apoptosis; lectin; leukemia; murine and human B cells.


Conflict of interest statement

The authors declare no conflict of interest.

Figures

Figure 1
Figure 1
Increased mitochondrial activity of murine B cells induced by ArtinM is not accompanied by B cell proliferation or IL-2 production. B cells were purified from a spleen cell suspension obtained from C57BL/6 mice, seeded in 96-well microplates (5 × 10⁵ cells/well), and incubated with ArtinM at different concentrations (AC). A mixture of Phorbol-12-myristate-13-acetate (PMA; 50 ng/mL) and Ionomycin (IONO; 1 µM) was used as a positive control for cell activation, and medium alone was used as a negative control (Medium). (A) Following 24 or 48 h incubation with ArtinM, 3-(4,5-dimethyl-2-thiazolyl)-2,5-diphenyl-2H-tetrazolium bromide (MTT; 50 µg/mL) was added to the cells, and mitochondrial activity was estimated by MTT reduction and expressed as a percentage calculated from the ratio between the absorbance of stimulated and non-stimulated B cells. (B) Following 48 h incubation with ArtinM, the proliferative rate of murine B cells was calculated according to thymidine incorporation ([3H]-TdR) (0.5 µCi/well); results are expressed as count per minute (CPM). (C) IL-2 levels in the supernatant of ArtinM-stimulated B cells, for 48 h, were measured using ELISA; the values are expressed in pg/mL. Significant differences compared to the medium are shown by *, p < 0.05 and ****, p < 0.0001.
Figure 2
Figure 2
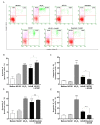
ArtinM increases the frequency of annexin V- and PI-positive B cells. B cells purified from a suspension of C57BL/6 mice spleen cells were seeded in 96-well microplates (5 × 10⁵ cells/well) and incubated for 24 h with ArtinM at several concentrations. Medium alone was used as a negative control (Medium). (A,B) B cells were labeled with annexin V FITC and propidium iodide (PI) to determine the frequency of apoptotic cells (annexin V + PI) by flow cytometry. (C) The frequency of IL-12+/IFN-γ+ double-positive cells was also determined by flow cytometry. A mixture of phorbol-12-myristate-13-acetate (PMA; 50 ng/mL) plus Ionomycin (IONO; 1 µM) was used as a positive control. Results are expressed as mean ± standard error of the mean (SEM), and three independent assays were performed. Significant differences compared to the medium are shown by *, p < 0.05; **, p < 0.01; and ***, p < 0.001. ns: not significant.
Figure 3
Figure 3
ArtinM binds Raji and Daudi cell surface through carbohydrate recognition, reducing Raji cells’ viability and increasing death. (A) Raji and (B) Daudi cells (1 × 10⁶ cells/mL) were fixed and incubated with biotinylated ArtinM (20 µg/mL), pre-treated or not with mannotriose (1 mM), mannose (20 mM) or lactose (20 mM). After washing, streptavidin-FITC (5 µg/mL) was added to the cells, which were analyzed by flow cytometry. Streptavidin-FITC alone was used as a negative control. Histograms represent the fluorescence intensity of cells for ArtinM detection; the positive range is indicated by the red line (M1). (C) Raji and (D) Daudi cells (1 × 10⁵ cells/mL) were distributed in 96-well microplates and incubated for 48 h at 37 °C with ArtinM at different concentrations. Medium alone was used as a negative control (Medium). The percentage of live and the frequency of dead (propidium iodide (PI)-positive) cells was determined by flow cytometry. The number of viable cells (grey bars) and the frequency of PI-positive cells (black circles) are shown in (C,D). (E,F) Raji and Daudi cells at different concentrations (1 to 8 × 10⁵ cells/mL) were distributed in 96-well microplates and incubated for 24 h at 37 °C with ArtinM (1.25 µg/mL for Raji cells and 20 µg/mL for Daudi cells). The concentration of viable cells was measured by flow cytometry using PI staining to determine the dead cells. The results are expressed as mean ± standard error of the mean (SEM); data are representative of three independent experiments performed in quadruplicate. Significant differences compared to the medium are shown by *, p < 0.05; **, p < 0.01; ***, p < 0.001; and **** p < 0.0001.
Figure 4
Figure 4
ArtinM induces apoptosis of Raji cells. Raji and Daudi cells (1 × 10⁵ cells/mL) were seeded in 96-well microplates and incubated for 48 h at 37 °C with 0.312 to 5.0 µg/mL and 1.25 to 20.0 µg/mL ArtinM, respectively. Arsenic trioxide (AS2O3) at concentrations of 12 µM (Raji cells) and 24 µM (Daudi cells) was used as a positive control for induction of cell death and medium alone was used as a negative control (Medium). The cells were incubated with annexin V-FITC (5.0 μg/mL) and propidium iodide (10.0 μg/mL), and the frequency of double-labeled (AnV+/PI+) Raji (A,B) and Daudi (C) cells was determined by flow cytometry. Values were expressed as mean ± standard error of the mean (SEM). Significant differences compared to the medium are shown by ***, p < 0.001 and ****, p < 0.0001.
Figure 5
Figure 5
Apoptosis of ArtinM-stimulated Raji cells involves Syk and caspase molecules. Raji or Daudi cells (1 × 10⁵ cells/mL) were seeded in 96-well microplates and stimulated with ArtinM at concentrations of 1.25 µg/mL (Raji cells) or 20.0 µg/mL (Daudi cells) for 24 or 48 h at 37 °C. Arsenic trioxide (AS2O3), at concentrations of 12 µM (Raji cells) and 24 µM (Daudi cells), was used as a positive control of cell death induction; culture medium alone (Medium) was a negative control. (A) Pharmacological inhibitors Z-VAD (10 µg/mL), Torin-1 (1 µM), and R406 (1 µg/mL) were added to the culture, and after 210 min the ArtinM lectin (1.25 µg/mL) was incubated with Raji cells. After 24 h, the cells were harvested and stained with PI to determine the concentration of viable cells of Raji. (BF) The relative expression of Smac/DIABLO (B), APAF1 (C), LC3-I (D), ATG14 (E), and ATG12 (F) was measured by qRT-PCR in ArtinM-stimulated Raji cells for 48 h. The Ct values of the target transcripts were normalized to the relative expression of β-actin as an endogenous control. The results are expressed as mean ± SEM, and the differences were considered significant at p < 0.05 (*), p < 0.001 (**), p < 0.001 (***), or p < 0.0001 (****).
Figure 6
Figure 6
TLR-2 signaling blockaged by OxPAPC reduced the Raji cells apoptosis induced by ArtinM. Raji cells (1 × 10⁵ cells/mL), seeded in 96-well microplates, were incubated with OxPAPC (30 µg/mL) and ArtinM (1.25 µg/mL) at the same time. After 24 h, propidium iodide (10 μg/mL) was added to the cell culture and its incorporation was detected by flow cytometry, allowing the quantification of viable and non-viable cells. Raji cells were incubated with only medium, OxPAPC, or ArtinM as control. Additionally, Raji cells were also incubated with OxPAPC (30 µg/mL) and Pam3Csk4 (1.25 µg/mL) at the same time, and as control the cells were incubated with only Pam3Csk4 (1.25 µg/mL). Arsenic trioxide (AS2O3) at 12 µM was used as a positive control. Based on the total cell number and the frequency of PI+ cells (dead cells, black bars) measured by flow cytometry, the concentration of viable cells (A) and frequency of PI+ cells (B) were determined. The results are expressed as mean ± standard error of the mean (SEM) of three independent experiments carried out in triplicate. Significant differences compared to the medium or the ArtinM alone are shown by *, p < 0.05; ** p < 0.01; ****, p < 0.0001.
Figure 7
Figure 7
Pharmacological inhibition of the signaling molecules p38, JNK, ERK, PKC, or PTK does not affect ArtinM-induced apoptosis of Raji cells. Raji cells (1 × 10⁵ cells/mL) were seeded in 96-well microplates and pre-treated or not with pharmacological inhibitors (20µM), such as SB202190 (p38MAPK inhibitor), SP600125 (JNK inhibitor), PD98059 (ERK inhibitor), H-7 (PKC inhibitor) and genistein (PTK inhibitor). After 210 min, the cells were stimulated with ArtinM (1.25 µg/mL) for 24 h at 37 °C. Arsenic trioxide (AS2O3; 12 μM) was used as a positive control of cell death induction, and the medium alone was used as a negative control (Medium). (A) The number of viable cells (cells/mL) was determined as the difference between the total number of cells and PI+ cells (dead cells), detected by flow cytometry. The results are expressed as mean ± standard error of three independent experiments in triplicates. (B,C) The relative frequency of apoptotic cells was determined by annexin V-FITC (5.0 μg/mL) and PI (10.0 μg/mL) staining; double-positive cells (AnV+/PI+) were detected by flow cytometry analysis, and their relative frequency was represented as a percentage. Values with significant differences in relation to the medium or cells stimulated only with ArtinM are shown by *, p < 0.05; ***, p < 0.001; ****, p < 0.0001. ns: not significant.
Figure 8
Figure 8
Pharmacological inhibitors of CD45 phosphatase activity and protein tyrosine kinases of the SCR family modify the cytotoxic effect of ArtinM in Raji cells. Raji (A,B,E,F) and Daudi (C,D,G,H) cells (1 × 10⁵ cells/mL), seeded in 96-well microplates, were pre-treated or not with the pharmacological inhibitors NQ-301 (AD) or dasatinib (EH) at different concentrations (0.5 to 0.1 µM) for 210 min, followed by stimulation with 1.25 µg/mL ArtinM (Raji cells) or 20 µg/mL ArtinM (Daudi cells). Arsenic trioxide (AS2O3) at 12 µM was used in Raji cells, and at 24 µM in Daudi cells, as a positive control. The unstimulated cells were used as a negative control. After 24 h, propidium iodide (10 μg/mL) was added to the cell culture and its incorporation was detected by flow cytometry, allowing the quantification of viable and non-viable cells. Based on the total cell number and the frequency of PI+ cells (dead cells, black bars), the quantification of viable cells (white bars) was determined. The results are expressed as mean ± standard error of the mean (SEM) of three independent experiments carried out in triplicates. Significant differences compared to the negative control (Medium) are shown by #, p < 0.05; ###, p < 0.001; ####, p < 0.0001. Significant differences compared to the ArtinM alone are shown by *, p < 0.05; ***, p < 0.001; ****, p < 0.0001.
Figure 9
Figure 9
NQ-301 and dasatinib differently affect apoptosis of ArtinM-stimulated Raji cells. Raji cells (1 × 10⁵ cells/mL) were seeded in 96-well microplates and pre-treated or not with the pharmacological inhibitors NQ-301 (AC) or dasatinib (AE) at a concentration of 0.2 µM for 210 min. The cells were stimulated with ArtinM (1.25 µg/mL). Arsenic trioxide (AS2O3; 12 µM) was used as a positive control of cell death, and medium alone as a negative control. After 24 h stimulation, the cells were incubated with AnV-FITC (5.0 μg/mL) and PI (10.0 μg/mL) and analyzed by flow cytometry to determine the relative frequency (%) of Raji cells labeled only with annexin V (AnV+) (B,D) or double-labeled annexin V-FITC plus PI (AnV+/PI+) (C,E). Significant differences compared to the medium or the isolated stimulus with ArtinM are shown by *, p < 0.05; ****, p < 0.0001.
Figure 10
Figure 10
Dasatinib inhibits apoptosis of murine B cells induced by ArtinM. Murine B cells (5 × 10⁵ cells/mL) seeded in 96-well microplates were pre-treated or not with 0.1 µM NQ-301 or dasatinib for 210 min. The cells were stimulated or not with ArtinM (0.625 µg/mL). The medium was used as a negative control. After 24 h, the cells were labeled with annexin V-FITC (5.0 μg/mL) and PI (10.0 μg/mL), and the frequency (%) of AnV+/PI+ B cells was determined by flow cytometry. Significant differences compared to the medium or stimulus with ArtinM are shown by *, p < 0.05.

References

    1. Mazola Y., Chinea G., Musacchio A. Glycosylation and Bioinformatics: Current Status for Glycosylation Prediction Tools. Biotecnol. Apl. 2011;28:6–12.
    1. Pinho S.S., Reis C.A. Glycosylation in Cancer: Mechanisms and Clinical Implications. Nat. Rev. Cancer. 2015;15:540–555. doi: 10.1038/nrc3982. - DOI - PubMed
    1. Smith B.A.H., Bertozzi C.R. The Clinical Impact of Glycobiology: Targeting Selectins, Siglecs and Mammalian Glycans. Nat. Rev. Drug Discov. 2021;20:217–243. doi: 10.1038/s41573-020-00093-1. - DOI - PMC - PubMed
    1. Wilhelm I., Levit-Zerdoun E., Jakob J., Villringer S., Frensch M., Übelhart R., Landi A., Müller P., Imberty A., Thuenauer R., et al. Carbohydrate-Dependent B Cell Activation by Fucose-Binding Bacterial Lectins. Sci. Signal. 2019;12:eaao7194. doi: 10.1126/scisignal.aao7194. - DOI - PubMed
    1. Ricci-Azevedo R., Roque-Barreira M.-C., Gay N.J. Targeting and Recognition of Toll-Like Receptors by Plant and Pathogen Lectins. Front. Immunol. 2017;8:1820. doi: 10.3389/fimmu.2017.01820. - DOI - PMC - PubMed