. 2023 Jan 6;24(2):1132.
doi: 10.3390/ijms24021132.

Streptozotocin-Induced Type 1 and 2 Diabetes Mellitus Mouse Models Show Different Functional, Cellular and Molecular Patterns of Diabetic Cardiomyopathy

Affiliations

Streptozotocin-Induced Type 1 and 2 Diabetes Mellitus Mouse Models Show Different Functional, Cellular and Molecular Patterns of Diabetic Cardiomyopathy

Fabiola Marino et al. Int J Mol Sci. .

Abstract

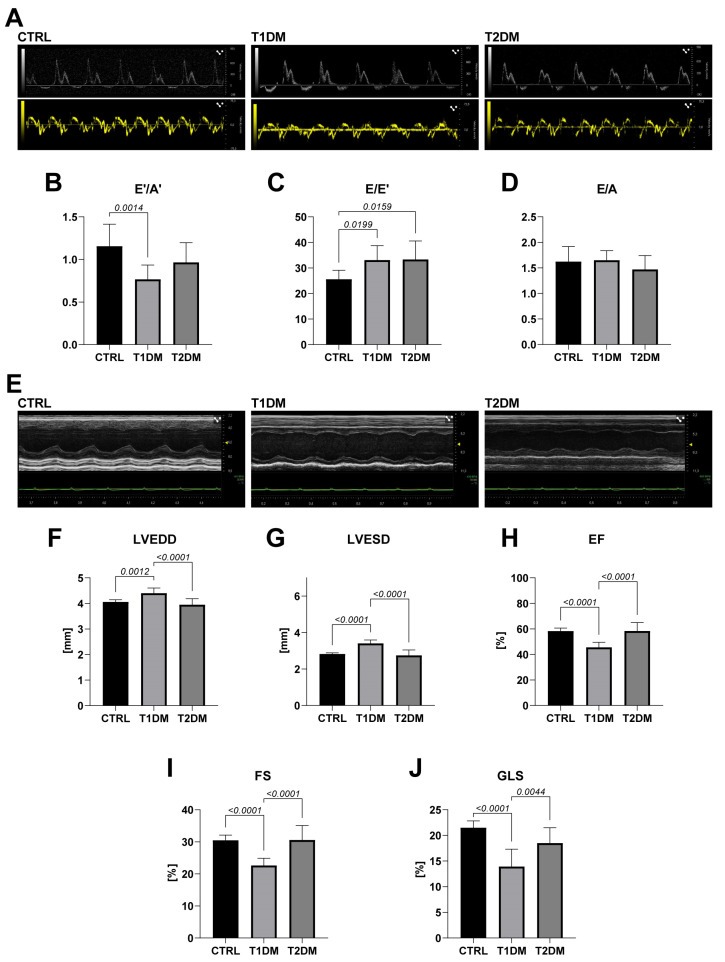
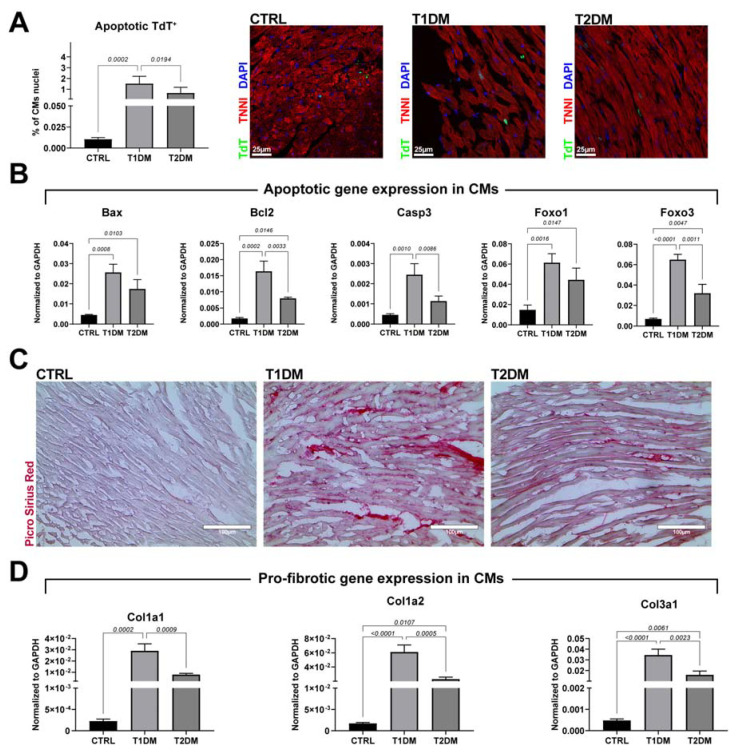
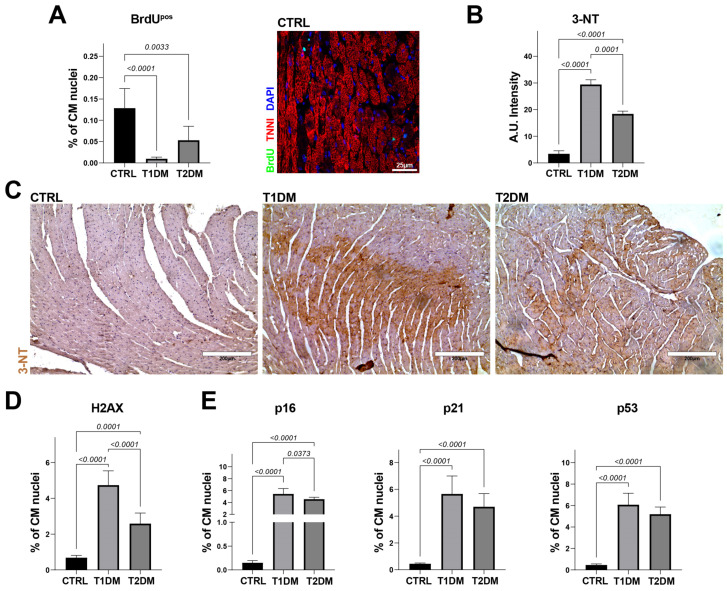
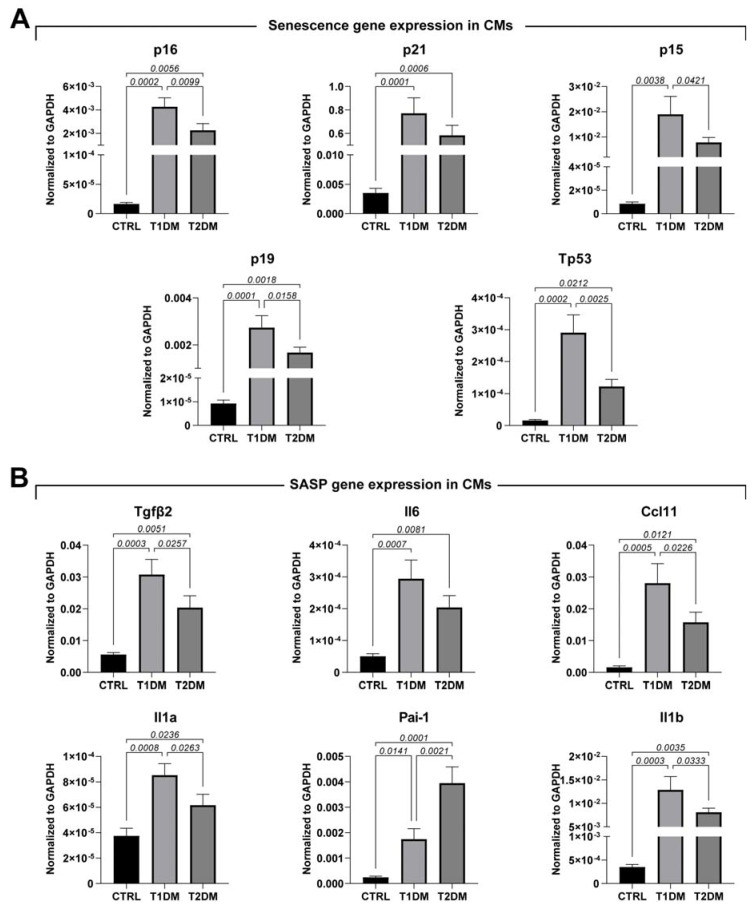
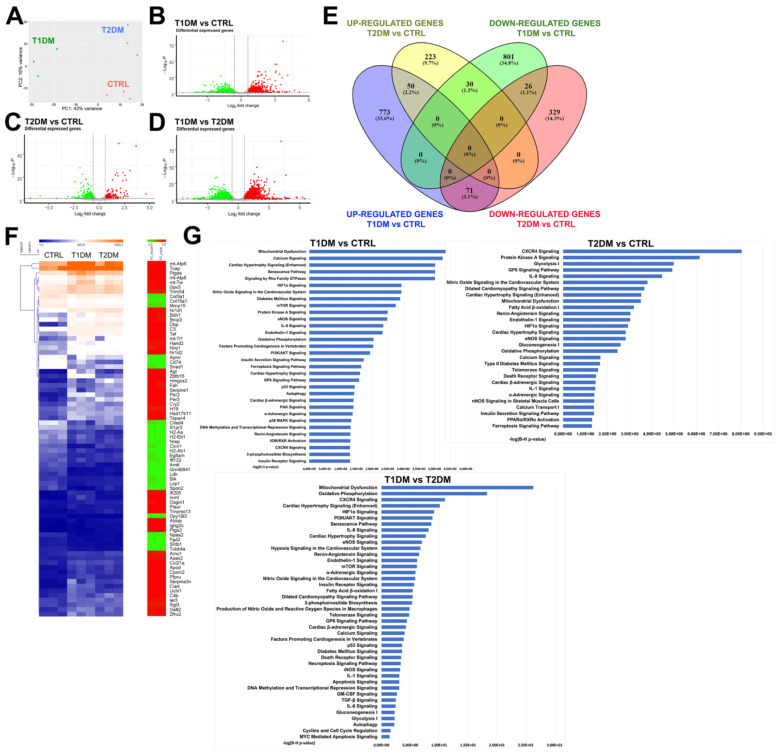
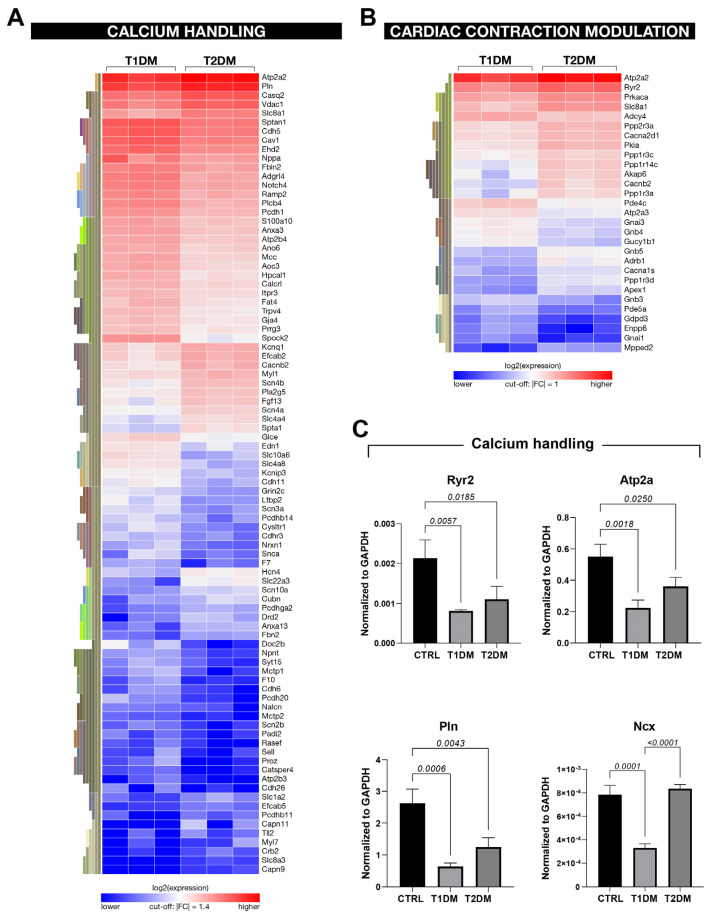
The main cause of morbidity and mortality in diabetes mellitus (DM) is cardiovascular complications. Diabetic cardiomyopathy (DCM) remains incompletely understood. Animal models have been crucial in exploring DCM pathophysiology while identifying potential therapeutic targets. Streptozotocin (STZ) has been widely used to produce experimental models of both type 1 and type 2 DM (T1DM and T2DM). Here, we compared these two models for their effects on cardiac structure, function and transcriptome. Different doses of STZ and diet chows were used to generate T1DM and T2DM in C57BL/6J mice. Normal euglycemic and nonobese sex- and age-matched mice served as controls (CTRL). Immunohistochemistry, RT-PCR and RNA-seq were employed to compare hearts from the three animal groups. STZ-induced T1DM and T2DM affected left ventricular function and myocardial performance differently. T1DM displayed exaggerated apoptotic cardiomyocyte (CM) death and reactive hypertrophy and fibrosis, along with increased cardiac oxidative stress, CM DNA damage and senescence, when compared to T2DM in mice. T1DM and T2DM affected the whole cardiac transcriptome differently. In conclusion, the STZ-induced T1DM and T2DM mouse models showed significant differences in cardiac remodeling, function and the whole transcriptome. These differences could be of key relevance when choosing an animal model to study specific features of DCM.

Keywords: cardiac cell senescence; left ventricular remodeling; myocardial regeneration; streptozotocin; type 1 diabetes mellitus; type 2 diabetes mellitus.


Conflict of interest statement

The authors declare no conflict of interest.

Figures

Figure 1
Figure 1
STZ-based T1DM and T2DM mouse models affected left ventricular diastolic and systolic function differently. (A) Representative pulsed-wave (PW) Doppler mitral velocity (MV) tracing and PW tissue Doppler imaging (TDI) velocity tracing in T1DM, T2DM and control (CTRL) mice. (BD) Cumulative data of diastolic function: E′/A′ ratio (B), E/E′ ratio (C) and E/A ratio (D) in T1DM vs. T2DM vs. CTRL mice (CTRL, n = 10; T1DM, n = 11; T2DM, n = 12). B: T1DM vs. CTRL, p = 0.0014. C: T1DM vs. CTRL, p = 0.0199; T2DM vs. CTRL; p = 0.0159 (one-way ANOVA with Tukey multiple comparison test). (E) Representative M-mode tracing of long-axis left ventricle in in T1DM, T2DM and CTRL mice. (FJ) Cumulative data of cardiac dimensions and systolic function in T1DM and T2DM when compared to control mice 8 weeks after STZ injection (CTRL, n = 10; T1DM, n = 11; T2DM, n = 12). (F) LVEDD = left ventricle and diastolic diameter; (G) LVESD = left ventricular end-systolic diameter; (H) EF = ejection fraction; (I) FS = fractional shortening; (J) GLS = global longitudinal strain. F: T1DM vs. CTRL, p = 0.0012; T1DM vs. T2DM, p < 0.0001. G: T1DM vs. CTRL, p <0.0001; T2DM vs. CTRL, p < 0.0001. H: T1DM vs. CTRL, p <0.0001; T2DM vs. CTRL, p < 0.0001. I: T1DM vs. CTRL, p < 0.0001. J: T1DM vs. CTRL, p < 0.0001; T1DM vs. T2DM, p = 0.0044 (one-way ANOVA with Tukey multiple comparison test). Data are mean ± SD.
Figure 2
Figure 2
STZ-based T1DM and T2DM mouse models displayed pathological left ventricular remodeling accompanied by stress-induced gene expression and hypertrophy. (A) Representative cross-section images of cardiac tissues, from CTRL, T1DM and T2DM mice, stained with hematoxylin and eosin. Scale bar = 100 µm. (CTRL, n = 7; T1DM, n = 8; T2DM, n = 9.) (B) Representative confocal images of cardiac cross-sections and bar graph showing cardiomyocyte hypertrophy in T1DM and T2DM mice when compared to CTRL mice (WGA, wheat germ agglutinin, Cy5 staining; cTnI, green; DAPI, blue nuclei). Scale bar = 25 µm. (CTRL, n = 7; T1DM, n = 8; T2DM, n = 9.) (C) Bar graphs showing the expressions of stress/hypertrophy genes in cardiomyocytes isolated from CTRL, T1DM and T2DM mice (n = 3). Data are mean ± SD.
Figure 3
Figure 3
STZ-based T1DM and T2DM mouse models differed in accumulation of reactive interstitial fibrosis in the left ventricular myocardium. (A) Bar graph and representative confocal images of apoptotic TdT (green)-positive cardiomyocyte nuclei in T1DM and T2DM mice compared to CTRL mice. Scale bar = 25 µm. (CTRL, n = 7; T1DM, n = 8; T2DM, n = 9.) (B) Bar graphs showing the expressions of apoptotic genes in cardiomyocytes isolated from CTRL, T1DM and T2DM mice (n = 3). (C) Representative light microscopy of Picrosirius red staining of T1DM and T2DM mice compared to CTRL mice. Scale bar = 100 µm. (CTRL, n = 7; T1DM, n = 8; T2DM, n = 9.) (D) Bar graphs showing the expressions of profibrotic genes in cardiomyocytes isolated from CTRL, T1DM and T2DM mice (n = 3). Data are mean ± SD.
Figure 4
Figure 4
STZ-based T1DM and T2DM mouse models affected myocardial oxidative stress differently. (A) Bar graph and representative confocal image showing the percentages of BrdU-positive CMs in CTRL, T1DM and T2DM (CTRL, n = 7; T1DM, n = 8; T2DM, n = 9). Scale bar= 25 µm. (B) Bar graph showing quantification of 3-NT intensity levels in T1DM and T2DM cross-sections compared to CTRL tissue sections. (C) Representative light microscopy showing 3-NT-positive cardiomyocytes (3-NT, brown) from T1DM, T2DM and CTRL mice (CTRL, n = 7; T1DM, n = 8; T2DM, n = 9). Scale bar = 200 µm. (D,E) Bar graphs showing the percentages of γ-H2AX-, p16-, p21- and p53-positive CMs in cardiac cross-sections from CTRL, T1DM and T2DM (CTRL, n = 7; T1DM, n = 8; T2DM, n = 9). Data are mean ± SD.
Figure 5
Figure 5
STZ-based T1DM and T2DM mouse models affected cardiac cell senescence differently. (A,B) Bar graphs showing the expressions of senescence and SASP markers in cardiomyocytes isolated from CTRL, T1DM and T2DM mice (n = 3). Data are mean ± SD.
Figure 6
Figure 6
STZ-based T1DM and T2DM mouse models displayed different global transcriptome profiles and gene-expression signatures. (A) 2D-PCA analyses based on mRNA expression levels in CTRL, T1DM and T2DM samples (n = 3 per group). (BD) Pairwise analysis of mRNA expressions between T1DM and CTRL, T2DM and CTRL and T1DM and T2DM, plotted in Volcano plots (|FC|1.5 and p ≤ 0.01). Red and green show the most significantly up- and downregulated mRNAs, respectively. (E) Venn diagram that shows the distributions of common, downregulated and upregulated genes in T1DM vs. CTRL, T2DM vs. CTRL and T1DM vs. T2DM. (F) Heat map showing similar fold changes of the common genes expressed in the two diabetic groups when compared to the same gene expressed in CTRL samples. (G) Functional categorization based on ingenuity pathway analysis (IPA) of the most significant canonical pathways generated in T1DM vs. CTRL, T2DM vs. CTRL and T1DM vs. T2DM. The ratio was calculated through division of the number of genes from our data set that mapped to each single pathway by the total number of genes included in the canonical pathway.
Figure 7
Figure 7
RNA-seq analysis from STZ-based T1DM and T2DM mouse models displayed modulation in the genes involved in calcium handling. (A,B) Heat maps showing differently expressed genes involved in the Ca2+ handling and cardiac contraction modulation processes in T1DM vs. T2DM. (C) Bar graphs showing the expressions of selected genes involved in Ca2+ handling in CMs isolated from CTRL, T1DM and T2DM mice (n = 3). Data are mean ± SD.

References

    1. NCD Risk Factor Collaboration Worldwide trends in diabetes since 1980: A pooled analysis of 751 population-based studies with 4.4 million participants. Lancet. 2016;387:1513–1530. doi: 10.1016/S0140-6736(16)00618-8. - DOI - PMC - PubMed
    1. Guariguata L., Whiting D., Weil C., Unwin N. The International Diabetes Federation diabetes atlas methodology for estimating global and national prevalence of diabetes in adults. Diabetes Res. Clin. Pract. 2011;94:322–332. doi: 10.1016/j.diabres.2011.10.040. - DOI - PubMed
    1. Rajbhandari J., Fernandez C.J., Agarwal M., Yeap B.X.Y., Pappachan J.M. Diabetic heart disease: A clinical update. World J. Diabetes. 2021;12:383–406. doi: 10.4239/wjd.v12.i4.383. - DOI - PMC - PubMed
    1. Raghavan S., Vassy J.L., Ho Y.L., Song R.J., Gagnon D.R., Cho K., Wilson P.W.F., Phillips L.S. Diabetes Mellitus-Related All-Cause and Cardiovascular Mortality in a National Cohort of Adults. J. Am. Heart Assoc. 2019;8:e011295. doi: 10.1161/JAHA.118.011295. - DOI - PMC - PubMed
    1. Leon B.M., Maddox T.M. Diabetes and cardiovascular disease: Epidemiology, biological mechanisms, treatment recommendations and future research. World J. Diabetes. 2015;6:1246–1258. doi: 10.4239/wjd.v6.i13.1246. - DOI - PMC - PubMed

MeSH terms