. 2023 Jan 6;24(2):1143.
doi: 10.3390/ijms24021143.

Brassica napus Roots Use Different Strategies to Respond to Warm Temperatures

Affiliations

Brassica napus Roots Use Different Strategies to Respond to Warm Temperatures

Marta Boter et al. Int J Mol Sci. .

Abstract

Elevated growth temperatures are negatively affecting crop productivity by increasing yield losses. The modulation of root traits associated with improved response to rising temperatures is a promising approach to generate new varieties better suited to face the environmental constraints caused by climate change. In this study, we identified several Brassica napus root traits altered in response to warm ambient temperatures. Different combinations of changes in specific root traits result in an extended and deeper root system. This overall root growth expansion facilitates root response by maximizing root-soil surface interaction and increasing roots' ability to explore extended soil areas. We associated these traits with coordinated cellular events, including changes in cell division and elongation rates that drive root growth increases triggered by warm temperatures. Comparative transcriptomic analysis revealed the main genetic determinants of these root system architecture (RSA) changes and uncovered the necessity of a tight regulation of the heat-shock stress response to adjusting root growth to warm temperatures. Our work provides a phenotypic, cellular, and genetic framework of root response to warming temperatures that will help to harness root response mechanisms for crop yield improvement under the future climatic scenario.

Keywords: Brassica napus; climate change; comparative transcriptomic analysis; crop adaptation; heat-shock response; root traits; temperature.


Conflict of interest statement

The authors declare no conflict of interest.

Figures
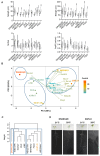
Figure 1
Figure 1
Differential RSA changes in B. napus varieties led to an increase in soil exploration in response to warm temperature. (A) Differential values of representative root trait categories: extent (network depth (Ndepth, cm)), size (network length, (Nleght, cm)), distribution (network length distribution (NLDist)), and shape (ellipse axis ratio (AspR), cm cm−1) traits of a collection of 10 spring oilseed rape genotypes grown at 21 °C and 29 °C. Statistical t-test analysis, *** FDR < 0.01. (B) Biplot of principal component analysis (PCA) based on all root traits analyzed, showing the high contribution of size and shape traits to variability of SOSR genotypes. Traits and varieties are colored based on contribution to the variance. Circles highlight the three different groups based on their root response to warming. (C) Dendrogram plot of SOSR genotypes. AGNES (agglomerative nested) hierarchical clustering was used, where Y-axis represents (dis)similarity based on Ward’s minimum variance method. Color boxes highlight three main clusters according to their root trait values. (D) Representative root organization of Drakkar and Duplo Brassica napus varieties grown in a pouch-and-wick system for 7 days at 21 °C or 29 °C.
Figure 2
Figure 2
B. napus primary root differentially responds to warm temperatures. (A) Dynamics of primary root growth in Drakkar and Duplo varieties grown at 21 °C and 29 °C. Graph represents means for 3 independent biological replicates. Statistical t-test analysis * p < 0.01, ** p < 0.001, *** p < 0.0001. (B) Ratio of root length and representative images of Drakkar and Duplo root phenotypes of 15-day-old seedlings grown at 21 °C and 29 °C in perlite pots. The ratios were similar to the values previously reported at 7 days. Scale bars, 5 cm. Statistical t-test analysis *** p < 0.0001.
Figure 3
Figure 3
Root meristem changes underlie differential root responses to warm temperatures in B. napus. (A) Meristematic cell number, meristem length, and average meristematic cell length of roots of Drakkar and Duplo varieties grown at 21 °C and 29 °C. Both varieties presented shorter root meristems at 29 °C than at 21 °C that correlated to a reduced number of meristematic cells in both genotypes. Statistical t-test analysis, *** FDR < 0.01. (B) Distribution of cell size frequencies of meristematic cells in roots of Drakkar and Duplo varieties grown at 21 °C and 29 °C. Warming resulted in a reduction in the number of shorter cells and a consistent increase in the frequencies of longer-sized cells. (C) Meristematic cell number, meristem length, and average meristematic cell length of cells in the apical (AM) and basal (BM) meristems of Drakkar and Duplo varieties grown at 21 °C and 29 °C. Statistical t-test analysis, *** p < 0.0001. (D) Average cell length of the meristematic cells according to their relative position in the root meristem, from the first cell close to the QC, considered as position 0 in the X-axis, to all the cells up to the last meristematic cell before the elongation zone, of Drakkar and Duplo varieties grown at 21 °C and 29 °C. The boundary between apical and basal meristem starts closer to the QC when roots are grown at warm temperature. Blue and orange arrows mark the boundary between apical and basal meristems at 21 °C and at 29 °C, respectively. (E) Confocal microscope images of Drakkar and Duplo double-labeled 5-ethynyl-29-deoxy-uridine (EdU, green) and 4′,6-diamidino-2-phenylindol (DAPI, blue) root meristems grown at 21 °C and 29 °C. Scale bar, 100μm. (F) EdU incorporation ratios (% EdU-labeled nuclei from DAPI-labeled nuclei) in Drakkar and Duplo root meristems grown at 21 °C and 29 °C. Statistical t-test analysis found no significant differences. (G) Relative number of mitotic cells (mitotic index) as the percentage of EdU-labeled M-phase nuclei out of the total number of EdU-labeled nuclei of Drakkar and Duplo root meristems grown at 21 °C and 29 °C. Statistical t-test analysis, ** p < 0.001. Inlet shows EdU-labeled (green) nuclei in M-phase (red arrow).
Figure 4
Figure 4
Warm temperatures increase cellular elongation in B. napus roots. (A) Elongation zone length, cell number, and average cell length of cells in the root EZ of Drakkar and Duplo varieties grown at 21 °C and 29 °C. Statistical t-test analysis, *** FDR < 0.01. (B) Confocal microscope images of mPS-PI-stained roots of 5-day-old seedlings of Drakkar and Duplo varieties grown at 21 °C compared to 29 °C. Yellow and blue arrows indicate the boundary between the root meristem and the EZ, and the EZ and the differentiation zone, respectively. Scale bars, 200 μm. (C) Cell size frequency distribution of the first 30 cells in the root elongation zone of Drakkar and Duplo varieties grown at 21 °C and 29 °C. (D) Average cell length of EZ cells according to their relative position in the root of Drakkar and Duplo varieties grown at 21 °C and 29 °C. (E) Cell length of the first cell of the differentiation zone in Drakkar and Duplo roots grown at 21 °C (green) and 29 °C (orange) Statistical t-test analysis * p < 0.01, ** p < 0.001.
Figure 5
Figure 5
B. napus genotypes modify their transcriptional programs to modify their root growth to respond to warm temperatures. (A) Volcano plot of average gene expression changes and number of all differentially expressed genes (DEGs) of Drakkar and Duplo root tips grown at 21 °C compared to 29 °C, representing a total of 3215 unique genes with altered expression at 29 °C. x-axis represents fold changes (Log2FC), and y-axis represents statistical significance (−Log10 of p value, −Log10p). The dashed lines show where −1 > log2FC > 1 and adjusted p value > 0.05 are located. Maroon dots represent upregulated genes, blue dots are downregulated, and black-grey dots represent no significant gene expression change. (B) Transcriptional changes of DEGs in response to warm temperatures in Drakkar compared to Duplo. Differential genes were hierarchically clustered into six groups, based on differences in log2FC ratio. Upregulated genes are represented in maroon, and downregulated genes are in blue. Each cluster of the heatmap is accompanied on the right by the most significant functional categories (GO categories) and their corresponding p-value in brackets. (C) Venn diagram showing total (orange), upregulated (maroon), and downregulated (blue) DEGs of Drakkar and Duplo root tips grown at 21 °C compared to 29 °C).
Figure 6
Figure 6
Transcriptional dynamics are altered in response to warm temperatures in B. napus roots. Gene expression levels of several genes representative of the main GOs enriched in three of the most significant transcriptional response patterns identified by hierarchical clustering analysis of Drakkar (DK) and Duplo (DP) root tips grown at 21 °C compared to 29 °C. As measured using quantitative RT-PCR (qPCR), relative gene expression values of genes from Cluster 1 were related with the response to oxidative stress (BnPRX71), fatty acids (BnACX2), cell wall (BnXTH24), as well as ethylene biosynthesis (BnSAM1) and cytokinin catabolism (BnCKX1) and showed similar pattern of expression in both varieties. Meanwhile, relative gene expression values of genes from Cluster 2 were related to response to hydrogen peroxide (BnCAT3) and high light intensity (BnGols1) together with core heat-shock response genes (HSR) such as chaperones (BnP23) and heat-shock proteins (HSPs) (BnHSA32 and BnHSP15.7). Cluster 4 was related with cell wall biogenesis and organization (BnXTR6 and BnEXPA8), as well as hormonal regulation, such as ABA signalling (BnPYL5), brassinosteroids (BnSTE1), and gibberellin (BnGA20 × 2) metabolism. All of these confirmed the differential expression patterns between varieties in response to warming. All the experiments were performed using three biological and three technical replicates. Expression values were normalized with those of BnACT7 (Chen et al., 2010). The second and third biological replicates are shown in Figure S3C.
Figure 7
Figure 7
Attenuation of heat-shock stress response is crucial to adjusting root response. (A) Comparison between fold change values of heat-shock (HS) response genes and non-heat-shock (nHS) response genes of Drakkar DEGs, showing that this group of HSR genes had the highest fold changes of Drakkar DEGs. x-axis represents three consecutive intervals of DK log2FC values (DK, Drakkar). Red boxes correspond to HS genes, whereas yellow boxes correspond to nHS genes. (B) Differences between Drakkar log2FC and Duplo log2FC of HS response genes and nHS response genes, showing the highest differences between Drakkar log2FC and Duplo log2FC. X-axis represents three consecutive intervals of ∆DK log2FC/DP log2FC values (DP, Duplo). Red boxes correspond to HS genes, whereas yellow boxes correspond to nHS genes. (C) Differential dynamics of heat-shock response gene expression (BnHSP17.6, BnHSP70, BnHSP23.6M, and BnGols1) at 24 h, 48 h, 4 days, and 7 days after being exposed to 29 °C compared to control temperature, 21 °C, in Drakkar and Duplo roots. Statistical t-test analysis of three biological replicates * p < 0.05. (D) Warm temperature-triggered changes of several root traits promote root response by facilitating roots’ access to extended areas of soil (blue square box). Enhanced cell division and elongation support this increase in RSA growth (orange square box). Transcriptional changes of different gene regulatory networks related with temperature signaling, plant growth, and nutrient balance drives these cellular changes that result in the differential RSA response (brown square box). Finally, coordinated attenuation of heat response is required for root response to warming temperatures in B. napus (brown square box).

References

    1. Dempewolf H., Eastwood R.J., Guarino L., Khoury C.K., Mller J.V., Toll J. Adapting Agriculture to Climate Change: A Global Initiative to Collect, Conserve, and Use Crop Wild Relatives. Agroecol. Sustain. Food Syst. 2014;38:369–377. doi: 10.1080/21683565.2013.870629. - DOI
    1. Tai A.P.K., Martin M.V., Heald C.L. Threat to future global food security from climate change and ozone air pollution. Nat. Clim. Chang. 2014;4:817–821. doi: 10.1038/nclimate2317. - DOI
    1. Godfray H.C.J., Beddington J.R., Crute I.R., Haddad L., Lawrence D., Muir J.F., Pretty J., Robinson S., Thomas S.M., Toulmin C. Food security: The challenge of feeding 9 billion people. Science. 2010;327:812–818. doi: 10.1126/science.1185383. - DOI - PubMed
    1. Ray D.K., Mueller N.D., West P.C., Foley J.A. Yield Trends Are Insufficient to Double Global Crop Production by 2050. PLoS ONE. 2013;8:e66428. doi: 10.1371/journal.pone.0066428. - DOI - PMC - PubMed
    1. Zaidi S.S., Vanderschuren H., Qaim M., Mahfouz M.M., Kohli A., Mansoor S., Tester M. New plant breeding technologies for food security. Science. 2019;363:1390–1391. doi: 10.1126/science.aav6316. - DOI - PubMed