. 2023 Jan 11;24(2):1421.
doi: 10.3390/ijms24021421.

Human Astrocyte Spheroids as Suitable In Vitro Screening Model to Evaluate Synthetic Cannabinoid MAM2201-Induced Effects on CNS

Affiliations

Human Astrocyte Spheroids as Suitable In Vitro Screening Model to Evaluate Synthetic Cannabinoid MAM2201-Induced Effects on CNS

Uliana De Simone et al. Int J Mol Sci. .

Abstract

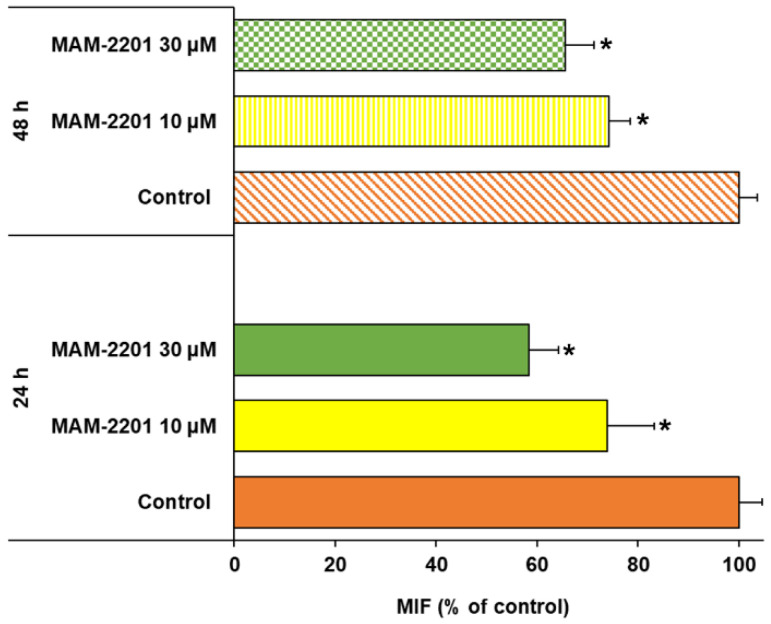
There is growing concern about the consumption of synthetic cannabinoids (SCs), one of the largest groups of new psychoactive substances, its consequence on human health (general population and workers), and the continuous placing of new SCs on the market. Although drug-induced alterations in neuronal function remain an essential component for theories of drug addiction, accumulating evidence indicates the important role of activated astrocytes, whose essential and pleiotropic role in brain physiology and pathology is well recognized. The study aims to clarify the mechanisms of neurotoxicity induced by one of the most potent SCs, named MAM-2201 (a naphthoyl-indole derivative), by applying a novel three-dimensional (3D) cell culture model, mimicking the physiological and biochemical properties of brain tissues better than traditional two-dimensional in vitro systems. Specifically, human astrocyte spheroids, generated from the D384 astrocyte cell line, were treated with different MAM-2201 concentrations (1-30 µM) and exposure times (24-48 h). MAM-2201 affected, in a concentration- and time-dependent manner, the cell growth and viability, size and morphological structure, E-cadherin and extracellular matrix, CB1-receptors, glial fibrillary acidic protein, and caspase-3/7 activity. The findings demonstrate MAM-2201-induced cytotoxicity to astrocyte spheroids, and support the use of this human 3D cell-based model as species-specific in vitro tool suitable for the evaluation of neurotoxicity induced by other SCs.

Keywords: CNS toxicity; human astrocytes; in vitro 3D models; novel psychoactive substances; preclinical studies; public health.


Conflict of interest statement

The authors declare no conflict of interest.

Figures

Figure 1
Figure 1
Morphology analysis by phase-contrast microscopy of the D384 spheroid formation over a 5-day period in 96-well spheroid microplate. At 2–6 h after seeding, D384 cells appeared without total compactness. On day 5, complete D384 spheroid formation was observed and this time point was chosen as the starting point for drug treatments. Scale bar: 100 µm.
Figure 2
Figure 2
(a) Morphology analysis by phase-contrast microscopy of the D384 spheroids after MAM-2201 exposure: MAM-2201 treatments did not cause morphological alterations to the spheroidal structure of spheroids, but induced an increase in the spheroid size at the highest concentration tested (30 µM) for both the 24 h (A1,B1) and 48 h (A2,B2) time points considered. Scale bar: 100 µm. (b) Biophysical characterization of D384 spheroids after 24 h (C) and 48 h (D) of MAM-2201 exposure in terms of (left panels) size, (central panels) weight, and (right panels) mass density. Box-and-whisker plots are indicative of the population distribution. * p < 0.05, ** p < 0.01, *** p < 0.001.
Figure 3
Figure 3
Spheroid histology. The cells were arranged close together and appeared densely packed at a starting density of 200 cells/well in the control spheroid samples at both 24 and 48 h. No necrotic core presence was observed in either the control or treated spheroids. In MAM-2201-treated spheroids, a loose cell packing and poor internal cohesion of cell-to-cell contacts were observed with an evident presence of interstitial spaces between individual cells. Scale bar: 100 μm.
Figure 4
Figure 4
Masson’s trichrome staining. Representative images of trichrome staining in D384 spheroid section treated with or without MAM-2201 after 24 h (a) and 48 h (b). The rectangle indicates the magnification (10×), black arrows indicate the ECM, and the arrow head indicates the empty spaces (reduction in the amount of collagen fibers). Scale bar: 100 μm.
Figure 5
Figure 5
Cell viability evaluation by trypan blue (TB) exclusion test; cytotoxicity effects after 24 and 48 h of exposure to increasing concentrations of MAM-2201 (1–30 μM). Data are normalized to the mean value obtained under control conditions, expressed as percentages (% of control), and plotted as the means ± S.E. * p < 0.05, statistical analysis by one-way ANOVA followed by Tukey’s multiple comparisons test.
Figure 6
Figure 6
Cell viability over time. Time- and concentration-dependent MAM-2201 effects: the effect started at ≥10 µM of MAM-2201 after 4 h and at ≥5 µM after 24 h of exposure. Results are provided as means ± S.E. of two independent experiments performed in eight replicates. * p < 0.05, statistical analysis by one-way ANOVA followed by Tukey’s multiple comparisons test.
Figure 7
Figure 7
(a) Composite images showing the evaluation of caspase-3/7 activity and (b) apoptotic cells in D384 spheroid sections after MAM-2201 exposure. The caspase-3/7 activity was impaired: an increase in the activity levels was observed in D384 spheroids starting from 5 to 30 μM for both time points considered (24–48 h). Apoptotic cells detected using Hoechst 33,258 staining were not visible after 48 h of exposure to MAM-2201 at the highest concentration tested (30 μM). The data obtained are provided as the means of the luminescence values (RLU) ± S.E. * p < 0.05, statistical analysis by one-way ANOVA followed by Tukey’s multiple comparisons test. Representative images in fluorescence microscope were taken using a magnification of 40×; scale bar: 50 μm.
Figure 8
Figure 8
(a) Flow cytometric and (b) immunofluorescence analyses of the cannabinoid receptor expression in D384 spheroid sections. A higher expression of CB1 receptors was observed compared to CB2 expression, as demonstrated by both flow cytometry and immunofluorescence staining. The flow cytometry data are expressed as median fluorescence intensities (MFIs) and represent the means ± S.D. The images show representative fluorescence-merged microphotographs with CB1-positive (green fluorescence) and CB2-positive (red fluorescence) areas in D384 spheroid sections. Nuclei were stained with Hoechst 33258. Scale bar: 100 μm.
Figure 9
Figure 9
Flow cytometry analysis of cannabinoid receptor expression in D384 spheroids after 24 and 48 h of exposure to MAM-2201 (10 and 30 µM). Data are expressed as MFI percentages (% of respective control) and plotted as the means ± S.D. * p < 0.05, statistical analysis by one-way ANOVA followed by Tukey’s multiple comparisons test.
Figure 10
Figure 10
Immunofluorescence analysis of the cannabinoid receptor expression in astrocyte spheroid section after (a) 24 and (b) 48 h of exposure to MAM-2201. A loss of the fluorescence signal of CB1 (green fluorescence) was observed in D384 spheroid sections, starting at 20 µM after 24 h and starting at 10 µM after 48 h. CB2 showed very low levels of the fluorescence intensity (red) in both the D384 spheroid control and treated spheroids after 24 h, which disappeared after 48 h in treated D384 spheroids. Nuclei were stained with Hoechst 33258. Scale bar: 100 μm.
Figure 10
Figure 10
Immunofluorescence analysis of the cannabinoid receptor expression in astrocyte spheroid section after (a) 24 and (b) 48 h of exposure to MAM-2201. A loss of the fluorescence signal of CB1 (green fluorescence) was observed in D384 spheroid sections, starting at 20 µM after 24 h and starting at 10 µM after 48 h. CB2 showed very low levels of the fluorescence intensity (red) in both the D384 spheroid control and treated spheroids after 24 h, which disappeared after 48 h in treated D384 spheroids. Nuclei were stained with Hoechst 33258. Scale bar: 100 μm.
Figure 11
Figure 11
Immunofluorescence analysis of GFAP in astrocyte spheroid sections after (a) 24 and (b) 48 h of exposure to MAM-2201 (10, 20, and 30 μM). A loss of the GFAP fluorescence signal (green) was observed in D384 spheroids, starting at 20 μM after 24 h, and was exacerbated and worsened (starting at 10 μM) after 48 h of exposure. Nuclei were stained with propidium iodide. Scale bar: 100 μm.

References

    1. EMCDDA European Drug Report 2019: Trends and Developments. Publications Office of the European Union, Luxembourg. [(accessed on 2 December 2022)]. Available online: http://www.emcdda.europa.eu/system/files/publications/11364/20191724_TDA....
    1. EMCDDA European Drug Report 2022: Trends and Developments. [(accessed on 2 December 2022)]. Available online: https://www.emcdda.europa.eu/publications/edr/trends-developments/2022_en.
    1. Auwärter V., Dresen S., Weinmann W., Müller M., Pütz M., Ferreirós N. ‘Spice’ and other herbal blends: Harmless incense or cannabinoid designer drugs? J. Mass Spectrom. 2009;44:832–837. doi: 10.1002/jms.1558. - DOI - PubMed
    1. Uchiyama N., Kikura-Hanajiri R., Ogata J., Goda Y. Chemical analysis of synthetic cannabinoids as designer drugs in herbal products. Forensic Sci. Int. 2010;198:31–38. doi: 10.1016/j.forsciint.2010.01.004. - DOI - PubMed
    1. Uchiyama N., Kawamura M., Kikura-Hanajiri R., Goda Y. Identification and quantitation of two cannabimimetic phenylacetylindoles JWH-251 and JWH-250, and four cannabimimetic naphthoylindoles JWH-081, JWH-015, JWH-200, and JWH-073 as designer drugs in illegal products. Forensic Toxicol. 2011;29:25–37. doi: 10.1007/s11419-010-0100-3. - DOI

Substances