. 2023 Jan 11;24(2):1444.
doi: 10.3390/ijms24021444.

Effects of Sequence Composition, Patterning and Hydrodynamics on the Conformation and Dynamics of Intrinsically Disordered Proteins

Affiliations

Effects of Sequence Composition, Patterning and Hydrodynamics on the Conformation and Dynamics of Intrinsically Disordered Proteins

Andrei Vovk et al. Int J Mol Sci. .

Abstract

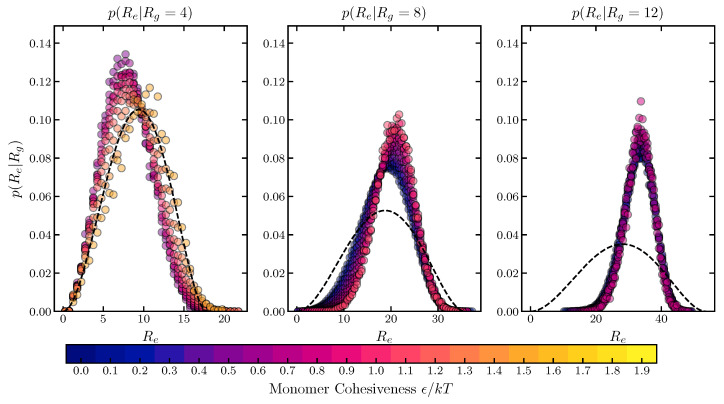
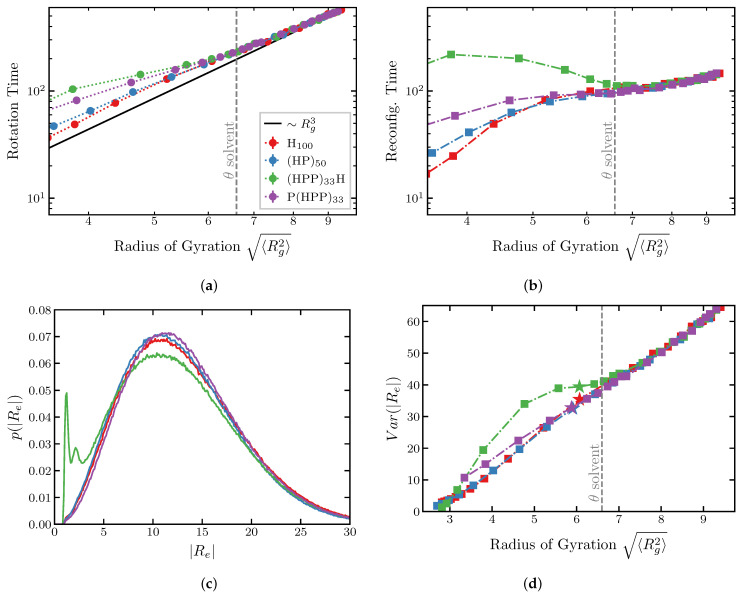
Intrinsically disordered proteins (IDPs) and intrinsically disordered regions (IDRs) perform diverse functions in cellular organization, transport and signaling. Unlike the well-defined structures of the classical natively folded proteins, IDPs and IDRs dynamically span large conformational and structural ensembles. This dynamic disorder impedes the study of the relationship between the amino acid sequences of the IDPs and their spatial structures and dynamics, with different experimental techniques often offering seemingly contradictory results. Although experimental and theoretical evidence indicates that some IDP properties can be understood based on their average biophysical properties and amino acid composition, other aspects of IDP function are dictated by the specifics of the amino acid sequence. We investigate the effects of several key variables on the dimensions and the dynamics of IDPs using coarse-grained polymer models. We focus on the sequence "patchiness" informed by the sequence and biophysical properties of different classes of IDPs-and in particular FG nucleoporins of the nuclear pore complex (NPC). We show that the sequence composition and patterning are well reflected in the global conformational variables such as the radius of gyration and hydrodynamic radius, while the end-to-end distance and dynamics are highly sequence-specific. We find that in good solvent conditions highly heterogeneous sequences of IDPs can be well mapped onto averaged minimal polymer models for the purpose of prediction of the IDPs dimensions and dynamic relaxation times. The coarse-grained simulations are in a good agreement with the results of atomistic MD. We discuss the implications of these results for the interpretation of the recent experimental measurements, and for the further applications of mesoscopic models of FG nucleoporins and IDPs more broadly.

Keywords: SAXS; amino acid sequence; end-to-end distance; hydrodynamic interactions; intrinsically disordered proteins; radius of gyration; sequence charge decoration.


Conflict of interest statement

The authors declare no competing interest.

Figures

Figure 1
Figure 1
(a) Polymer dimensions of a homopolymer for varying monomer cohesiveness. (b) Asphericity of a homopolymer for varying monomer cohesiveness. (c) Ratio of the square of the end-to-end distance to the square of the radius of gyration of a homopolymer for varying monomer cohesiveness. The dashed lines correspond to the Gaussian chain predictions; the solid lines correspond to a uniform sphere. The ratio of square of the end-to-end distance to the square of the radius of gyration agrees with the Gaussian chain prediction (Re2/Rg2=6) at the θ point (ϵ0.70.75kT). (d) Blue: ratio of the radius of gyration to the hydrodynamic radius. Purple: ratio of the radius of gyration to the Kirkwood approximation to the hydrodynamic radius. The good solvent corresponds to ϵ=0, the θ solvent corresponds to ϵ0.70.75kT and poor solvents correspond to ϵ>1.5kT. The number of monomers is N=100.
Figure 2
Figure 2
Probability distributions of the end-to-end distance of a homopolymer, conditioned on the sub-ensembles with different radii of gyration. The circle symbols show the simulation results. The color of the symbol (blue to yellow) corresponds to low to high values of ϵ. The black dashed line shows the distribution of the end-to-end distance of the Sanchez–Haran model. The number of monomers is N=100. Polymer dimensions are in the units of 23b0 where b0 is the monomer diameter. Histogram bin size for calculation of the distribution is 0.5; see Section 4.
Figure 3
Figure 3
Polymer dimensions as a function of the cohesiveness. (a) Radius of gyration. (b) Equivalent Homopolymer ϵ, determined using linear interpolation. The dotted line is the equivalence to Rg2. The solid line is a fit to (eaϵ1)/b for the points before the inflection; see text. (c) Ratio of the end-to-end distance squared to the radius of gyration squared. (d) Ratio of the radius of gyration to hydrodynamic radius (in Kirkwood approximation). All sequences are composed of 30 cohesive and 30 neutral monomers for varying monomer cohesiveness. The size of the hydrophobic patches varies from 1 to 5; exact sequences are shown in the legend. For comparison, a homopolymer sequence of 60 cohesive monomers is shown in black. The dashed lines correspond to the Gaussian chain predictions, the solid lines correspond to a uniform sphere. fH is the fraction of cohesive monomers in the sequence. Radius of gyration is in units of 23b0 where b0 is the monomer diameter, as described in Section 4.
Figure 4
Figure 4
Dimensions of charged polymers. (a) Sequences composed of 25 positively and 25 negatively charged amino acids with their corresponding Sequence Charge Decoration (SCD) κ charge pattern parameters; see text. “K” represents positively charged lysine and “E” represents negatively charged glutamic acid. (b) Radii of gyration of the sequences. Black symbols: coarse-grained model; red symbols: ABSINTH model. (c) Squared ratio of the end-to-end distance to the radius of gyration. (d) Ratio of the radius of gyration to the hydrodynamic radius (in Kirkwood approximation). Solid black line is the effective homopolymer representation (see Figure 5). The dashed lines correspond to the Gaussian chain predictions, the solid lines correspond to a uniform sphere.
Figure 5
Figure 5
Equivalent homopolymer model. (a) Cohesiveness ϵh of the effective homopolymer model that reproduces the radii of gyrations of sequences with cohesiveness ϵ shown in Figure 3 and Table 1, as a function of their SCD. (b) Cohesiveness ϵh of the effective homopolymer model that reproduces the Rg/Rk ratio of the sequences composed of 25 positively and 25 negatively charged monomers shown in Figure 4, as a function of their SCD value. The red dots show the individual correspondence for each sequence based on Figure 3. The black line is the smoothed isotonic regression Rg/Rk vs. SCD; see text.
Figure 6
Figure 6
Normalized autocorrelation functions (ACF) of the (a) end-to-end vector and (b) end-to-end distance. Homopolymer model with N=100.
Figure 7
Figure 7
Relaxation times of the end-to-end vector and distance. (a) Relaxation time of the end-to-end vector (“rotation time”) and (b) the end-to-end distance (“reconfiguration time”) for the different sequences indicated in the legend of (a). The x-axis shows the mean square radius of gyration controlled by monomer cohesiveness in the simulations. (c) End-to-end distance probability distribution. Red line: H100 sequence; ϵ/kT=0.9. Blue line: (HP)50 sequence; ϵ/kT=3.2. Green line: (HPP)33H sequence; ϵ/kT=5.4. Purple line: P(HPP)33; ϵ/kT=5.6. The radius of gyration Rg6±0.1 for all sequences (see (d)). (d) Variance of the end-to-end distance as a function the radius of gyration of the chains. Stars indicate the radii of gyration of the sequences for the parameter values in (c). Deviation of the green line from the others below the θ-point reflect the emergence of the secondary peak in the end-to-end distribution in (c). See text.

References

    1. Uversky V.N. Intrinsically disordered proteins from A to Z. Int. J. Biochem. Cell Biol. 2011;43:1090–1103. doi: 10.1016/j.biocel.2011.04.001. - DOI - PubMed
    1. Habchi J., Tompa P., Longhi S., Uversky V.N. Introducing protein intrinsic disorder. Chem. Rev. 2014;114:6561–6588. doi: 10.1021/cr400514h. - DOI - PubMed
    1. Dunker A.K., Oldfield C.J., Meng J., Romero P., Yang J.Y., Chen J.W., Vacic V., Obradovic Z., Uversky V.N. The unfoldomics decade: An update on intrinsically disordered proteins. BMC Genom. 2008;9:S1. doi: 10.1186/1471-2164-9-S2-S1. - DOI - PMC - PubMed
    1. Tompa P. Intrinsically disordered proteins: A 10-year recap. Trends Biochem. Sci. 2012;37:509–516. doi: 10.1016/j.tibs.2012.08.004. - DOI - PubMed
    1. Hoogenboom B.W., Hough L.E., Lemke E.A., Lim R.Y., Onck P.R., Zilman A. Physics of the nuclear pore complex: Theory, modeling and experiment. Phys. Rep. 2021;921:1–53. doi: 10.1016/j.physrep.2021.03.003. - DOI - PMC - PubMed

Substances

LinkOut - more resources