. 2023 Jan 12;24(2):1495.
doi: 10.3390/ijms24021495.

Peculiar Ca2+ Homeostasis, ER Stress, Autophagy, and TG2 Modulation in Celiac Disease Patient-Derived Cells

Affiliations

Peculiar Ca2+ Homeostasis, ER Stress, Autophagy, and TG2 Modulation in Celiac Disease Patient-Derived Cells

Silvia Sposito et al. Int J Mol Sci. .

Abstract

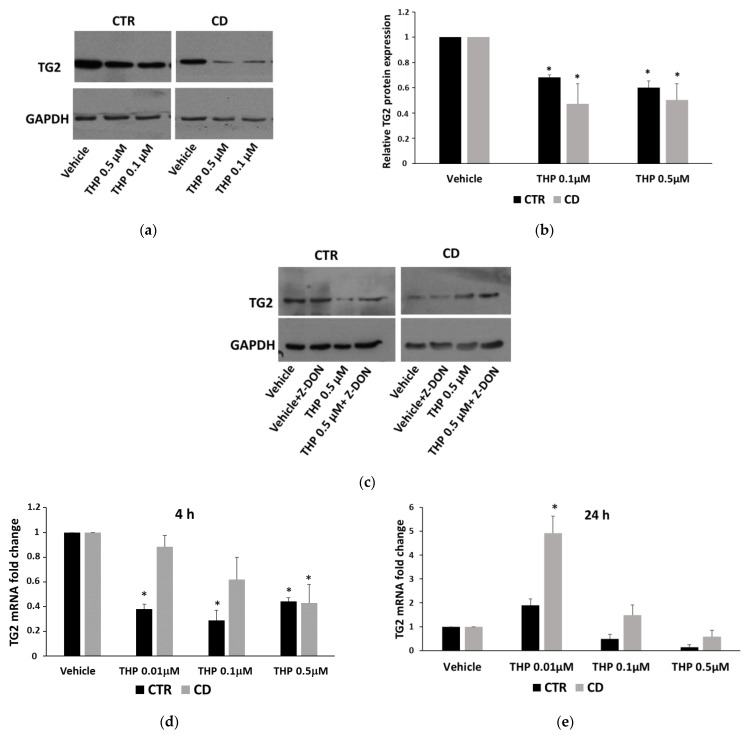
Celiac disease (CD) is an inflammatory intestinal disease caused by the ingestion of gluten-containing cereals by genetically predisposed individuals. Constitutive differences between cells from CD patients and control subjects, including levels of protein phosphorylation, alterations of vesicular trafficking, and regulation of type 2 transglutaminase (TG2), have been reported. In the present work, we investigated how skin-derived fibroblasts from CD and control subjects responded to thapsigargin, an endoplasmic reticulum ER stress inducer, in an attempt to contribute to the comprehension of molecular features of the CD cellular phenotype. We analyzed Ca2+ levels by single-cell video-imaging and TG2 activity by a microplate assay. Western blots and PCR analyses were employed to monitor TG2 levels and markers of ER stress and autophagy. We found that the cytosolic and ER Ca2+ level of CD cells was lower than in control cells. Treatments with thapsigargin differently activated TG2 in control and CD cells, as well as caused slightly different responses regarding the activation of ER stress and the expression of autophagic markers. On the whole, our findings identified further molecular features of the celiac cellular phenotype and highlighted that CD cells appeared less capable of adapting to a stress condition and responding in a physiological way.

Keywords: Ca2+ homeostasis; ER stress; autophagy; celiac disease; thapsigargin; type 2 transglutaminase; unfolded protein response.


Conflict of interest statement

The authors declare no conflict of interest.

Figures

Figure 1
Figure 1
Relative cell viability measured by an MTT assay after treatments with THP ranging from 0.01 to 1 µM (for 24 h) or from 0.01 to 0.5 µM (for 48 and 72 h). Basal viability is measured in the presence of the vehicle (DMSO 0.05%). In all experiments, the vehicle reduced cell viability by no more than 10–15%. Data are reported as means ± standard error (SE) from two independent experiments, each performed in triplicate, on three non-CD cultures and three CD cultures. * p < 0.05 versus the respective vehicle.
Figure 2
Figure 2
Ca2+ level measurement in skin-derived fibroblasts. (a) Superimposed single-cell traces representative of the rapid effect of THP on [Ca2+]i in one representative non-CD sample and one representative CD sample. Starting time of perfusion with THP is indicated by the arrow. (b) Quantification of basal [Ca2+]i in four non-CD and three CD cultures. (c) Quantification of Ca2+ release from ER after treatment with THP in four non-CD and three CD cultures. For each experiment, 40–50 individual cells were monitored. * p < 0.05 versus controls (Student’s t-test for unpaired data).
Figure 3
Figure 3
GRP78 expression. (a) Representative Western blot of the basal level of GRP78 in samples from three control and three celiac cultures. (b) Densitometric analyses of GRP78 basal levels, normalized with respect to GAPDH expression, relative to five controls and five celiac cultures. (c) Relative basal GRP78 mRNA levels measured in cultures from three control and three CD subjects. In panels (ac), data are reported as mean ± SE. * p < 0.05 vs. controls (Student’s t-test for unpaired data). (d) Representative Western blot anti-GRP78 on samples from one control and one celiac culture in the presence of THP for 24 h. (e) Densitometric analyses relative to Western blot anti-GRP78 on samples from three control and three celiac cultures in the presence of THP. (f,g) Relative GRP78 mRNA levels measured in samples from three control and three celiac cultures in the presence of THP for 4 h and for 24 h, respectively. In (eg) protein and mRNA levels are normalized with respect to GAPDH expression and expressed as variation with respect to the relative vehicle-treated sample. Data are reported as mean ± SE. * p < 0.05 vs. the respective vehicle.
Figure 3
Figure 3
GRP78 expression. (a) Representative Western blot of the basal level of GRP78 in samples from three control and three celiac cultures. (b) Densitometric analyses of GRP78 basal levels, normalized with respect to GAPDH expression, relative to five controls and five celiac cultures. (c) Relative basal GRP78 mRNA levels measured in cultures from three control and three CD subjects. In panels (ac), data are reported as mean ± SE. * p < 0.05 vs. controls (Student’s t-test for unpaired data). (d) Representative Western blot anti-GRP78 on samples from one control and one celiac culture in the presence of THP for 24 h. (e) Densitometric analyses relative to Western blot anti-GRP78 on samples from three control and three celiac cultures in the presence of THP. (f,g) Relative GRP78 mRNA levels measured in samples from three control and three celiac cultures in the presence of THP for 4 h and for 24 h, respectively. In (eg) protein and mRNA levels are normalized with respect to GAPDH expression and expressed as variation with respect to the relative vehicle-treated sample. Data are reported as mean ± SE. * p < 0.05 vs. the respective vehicle.
Figure 4
Figure 4
Detection of XBP1 splicing after treatments of control and CD cells with THP for 4 h. (a) Spliced (s) and unspliced (us) forms of XBP1 in representative samples are detected in a 2.5% agarose gel after staining with ethidium bromide. (b) Quantification of XBP1 splicing in cultures from three control and three CD subjects expressed as a ratio between densitometric values of s-XBP1 and us-XBP1. Data are reported as mean ± SE. * p < 0.05 vs. the respective vehicle. ** p < 0.05 as indicated (Student’s t-test for unpaired data).
Figure 5
Figure 5
Basal LC3 expression. (a) Representative Western blot anti-LC3 showing basal levels of LC3-I and LC3-II on samples from two control and two celiac cultures. (b) Representation of ratio between LC3-II and LC3-I forms in samples from four controls and four CD cultures. Data are reported as mean ± SE. * p < 0.05 versus controls (Student’s t-test for unpaired data). (c) Representative confocal images of LC3 in cells from two control cultures and two CD ones (63× magnification).
Figure 6
Figure 6
LC3 expression in cells treated with THP (a) Representative Western blot anti-LC3 on samples from one control and one celiac culture in the presence of THP for 24 h. (b,c) Densitometric analyses relative to Western blot anti-LC3 on samples from three control and three celiac cultures, respectively, in the presence of THP. Protein levels of LC3-I and LC3-II are normalized with respect to GAPDH expression. Data are reported as mean ± SE. * p < 0.05 vs. the respective vehicle.
Figure 6
Figure 6
LC3 expression in cells treated with THP (a) Representative Western blot anti-LC3 on samples from one control and one celiac culture in the presence of THP for 24 h. (b,c) Densitometric analyses relative to Western blot anti-LC3 on samples from three control and three celiac cultures, respectively, in the presence of THP. Protein levels of LC3-I and LC3-II are normalized with respect to GAPDH expression. Data are reported as mean ± SE. * p < 0.05 vs. the respective vehicle.
Figure 7
Figure 7
p62 expression. (a) Representative Western blot of basal level of p62 in samples from two control and two celiac cultures. (b) Densitometric analyses of p62 basal levels, normalized respect to GAPDH expression, relative to samples from four controls and from four celiac cultures. Data are reported as mean ± SE. * p < 0.05 vs. controls (Student’s t-test for unpaired data). (c) Representative Western blot anti-p62 on samples from one control and one celiac culture in the presence of THP for 24 h. (d) Densitometric analyses relative to Western blot anti-p62 on samples from three control and three celiac cultures in the presence of THP. Protein levels are normalized with respect to GAPDH expression and reported as variations with respect to the relative vehicle-treated sample. Data are reported as mean ± SE. * p < 0.05 vs. the respective vehicle.
Figure 8
Figure 8
p62 expression in fibroblasts treated for 4 with THP. (a) Representative Western blot anti-p62 on samples from one control and one celiac culture. (b) Densitometric analyses of p62 basal levels relative to samples from three controls and from three celiac cultures in the presence of THP. Protein levels are normalized with respect to GAPDH expression and reported as variations with respect to the relative vehicle-treated sample. Data are reported as mean ± SE. * p < 0.05 vs. the respective vehicle.
Figure 9
Figure 9
LC3 levels in the presence of starvation medium and/or of bafilomycin A1. (a) Representative Western blot anti-LC3 on samples from one control and one celiac culture, treated with bafilomycin A1 1 µM for 4 h; where indicated, cells were previously starved for 2 h. (b) Densitometric analyses of LC3-II isoform levels relative to samples from three controls and three celiac cultures treated as in (a). Protein levels are normalized with respect to GAPDH expression and reported as variations with respect to the relative vehicle-treated sample. Data are reported as mean ± SE. * p < 0.05 vs. the respective vehicle. (c) Confocal immunofluorescence images of fibroblasts from control and celiac subjects stained with anti-LC3 antibodies (magnification 63×).
Figure 9
Figure 9
LC3 levels in the presence of starvation medium and/or of bafilomycin A1. (a) Representative Western blot anti-LC3 on samples from one control and one celiac culture, treated with bafilomycin A1 1 µM for 4 h; where indicated, cells were previously starved for 2 h. (b) Densitometric analyses of LC3-II isoform levels relative to samples from three controls and three celiac cultures treated as in (a). Protein levels are normalized with respect to GAPDH expression and reported as variations with respect to the relative vehicle-treated sample. Data are reported as mean ± SE. * p < 0.05 vs. the respective vehicle. (c) Confocal immunofluorescence images of fibroblasts from control and celiac subjects stained with anti-LC3 antibodies (magnification 63×).
Figure 10
Figure 10
Enzymatic activity of intracellular TG2 expressed as absorbance at 450 nm in skin-derived fibroblasts from three controls and three CD subjects. Data are reported as mean ± SE. * p < 0.05 versus respective untreated samples.
Figure 11
Figure 11
TG2 expression in the presence of THP. (a) Representative Western blot anti-TG2 on samples from one control and one celiac culture treated with THP for 24 h. (b) Densitometric analyses relative to Western blot anti-TG2 on samples from three control and three celiac cultures treated with THP for 24 h. (c) Western blot anti-TG2 on samples from one control and one celiac culture treated with THP for 4 h. (d,e) Relative TG2 mRNA levels measured in samples from three control and three celiac cultures treated with THP for 4 h and for 24 h, respectively. Protein and mRNA levels are normalized with respect to GAPDH expression. Data are reported as mean ± SE. * p < 0.05 vs. respective vehicle.
Figure 12
Figure 12
LC3 expression in the presence of the TG2 inhibitor Z-DON. (a) Representative Western blot anti-LC3 on samples from one control and one celiac culture in the presence of THP, Z-DON, and both for 24 h. (b,c) Densitometric analyses relative to Western blot anti-LC3 on samples from three control and three celiac cultures, respectively, in the presence of THP, Z-DON, and both. Protein levels of LC3 I and LC3-II are normalized with respect to GAPDH expression. Data are reported as mean ± SE. * p < 0.05 as indicated (Student’s t-test for unpaired data).

Similar articles

Cited by

References

    1. Sollid L.M. Molecular basis of celiac disease. Annu. Rev. Immunol. 2000;18:53–81. doi: 10.1146/annurev.immunol.18.1.53. - DOI - PubMed
    1. Voisine J., Abadie V. Interplay between Gluten, HLA, Innate and Adaptive Immunity Orchestrates the Development of Coeliac Disease. Front. Immunol. 2021;12:674313. doi: 10.3389/fimmu.2021.674313. - DOI - PMC - PubMed
    1. Wieser H. Chemistry of gluten proteins. Food Microbiol. 2007;24:115–119. doi: 10.1016/j.fm.2006.07.004. - DOI - PubMed
    1. Caio C., Volta U., Sapone A., Leffler D.A., De Giorgio R., Catassi C., Alessio F. Celiac disease: A comprehensive current review. BMC Med. 2019;17:142. doi: 10.1186/s12916-019-1380-z. - DOI - PMC - PubMed
    1. Sollid L.M. The roles of MHC class II genes and post-translational modification in celiac disease. Immunogenetics. 2017;69:605–616. doi: 10.1007/s00251-017-0985-7. - DOI - PubMed