

Low-Diversity Microbiota in Apical Periodontitis and High Blood Pressure Are Signatures of the Severity of Apical Lesions in Humans
- PMID: 36675104
- PMCID: PMC9866854
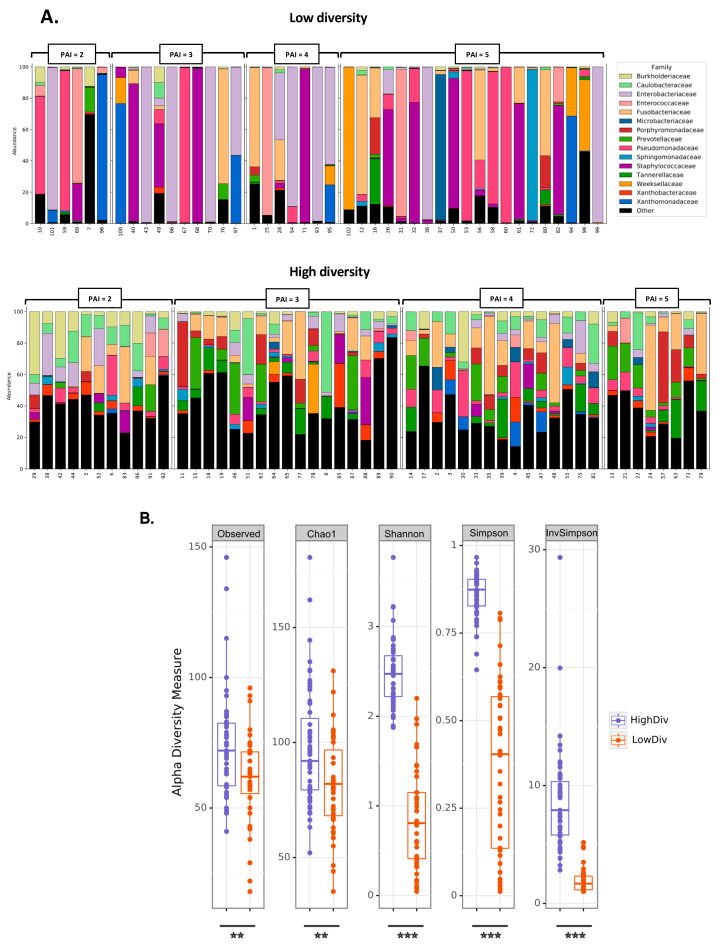
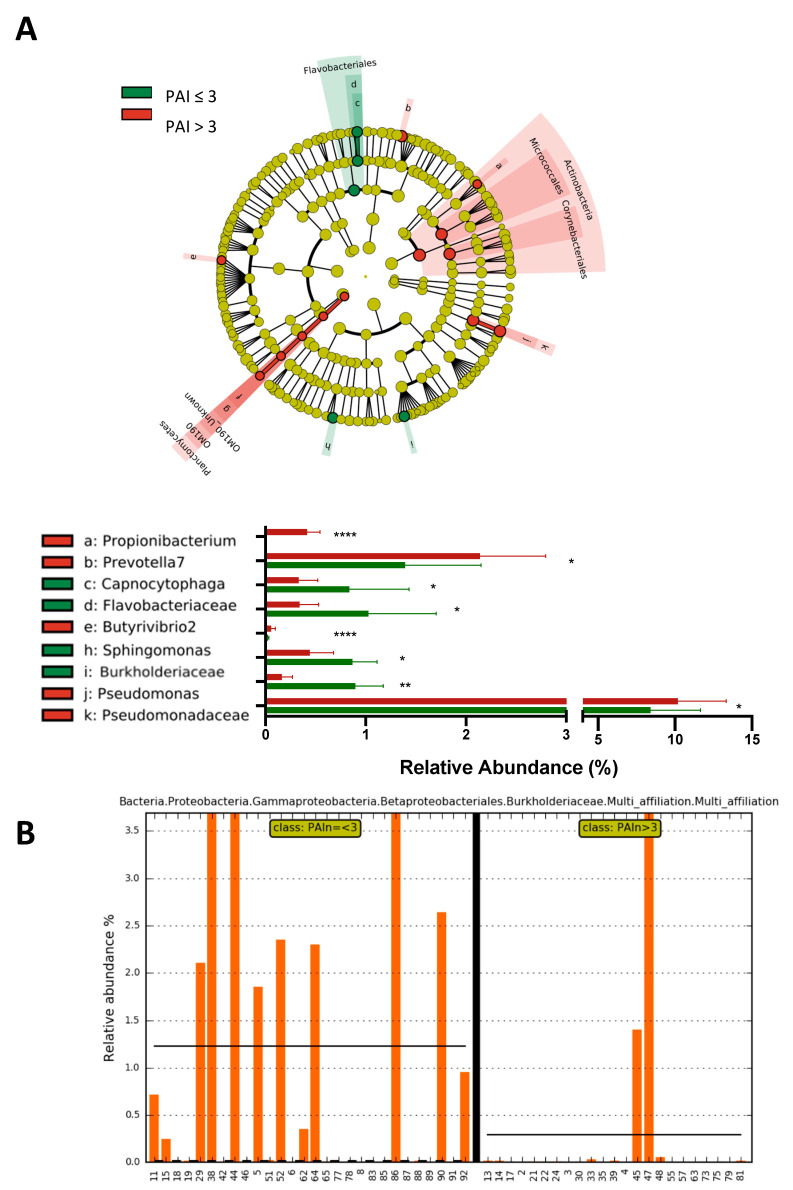
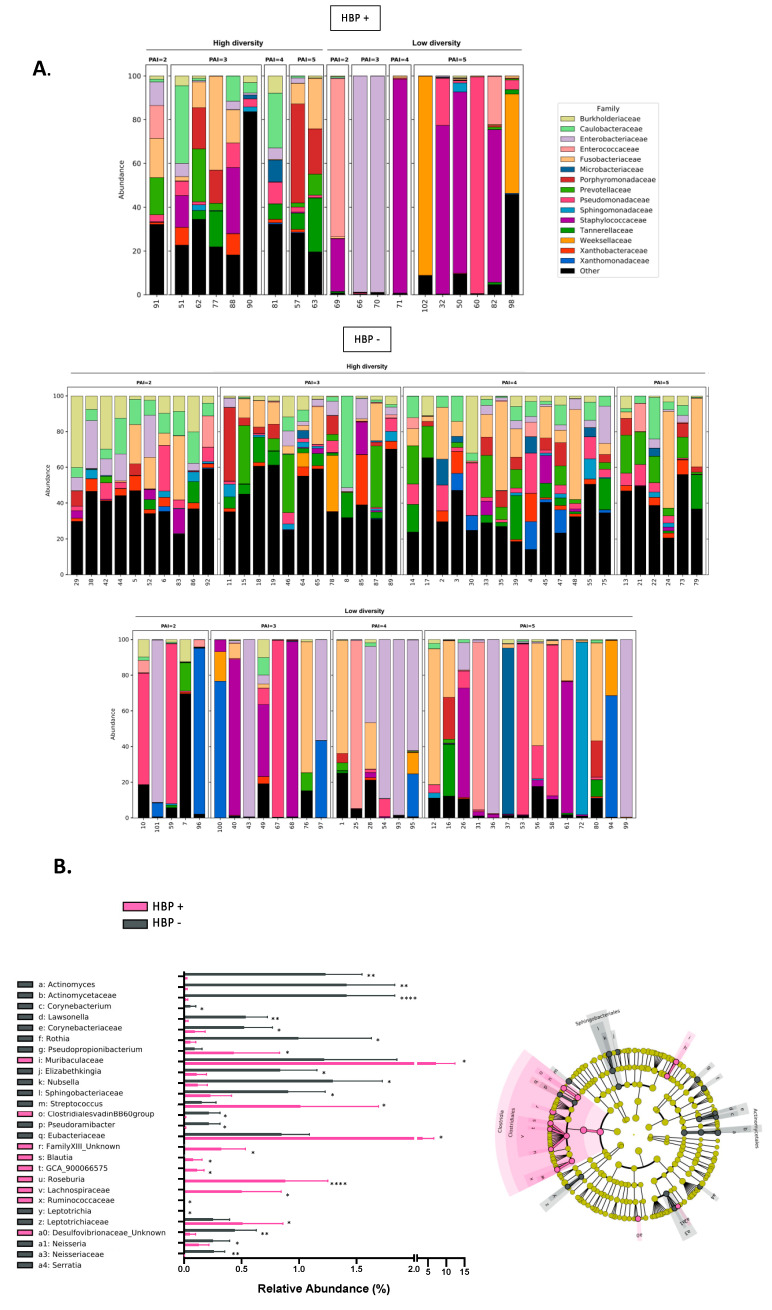
- DOI: 10.3390/ijms24021589
Low-Diversity Microbiota in Apical Periodontitis and High Blood Pressure Are Signatures of the Severity of Apical Lesions in Humans
Abstract
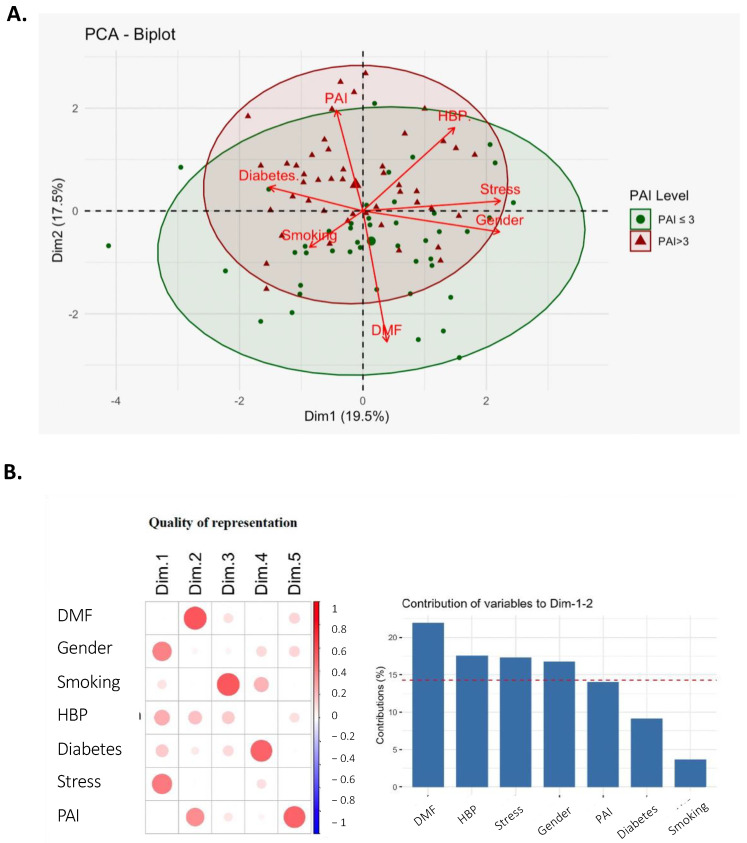
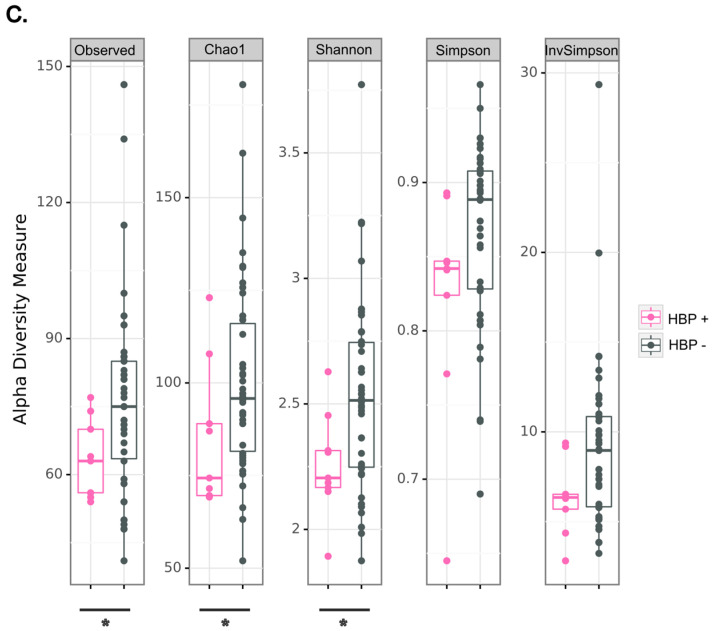
(1) Background: In developed countries, the prevalence of apical periodontitis (AP) varies from 20% to 50% for reasons that could be associated with the apical periodontitis microbiota ecology. (2) Methods: We performed a clinical study in the Odontology department of Toulouse hospital in France, to sequence the 16S rRNA gene of AP microbiota and collect clinical parameters from 94 patients. Forty-four patients were characterized with a PAI (periapical index of AP severity) score lower or equal to 3, while the others had superior scores (n = 50). (3) Results: The low diversity of granuloma microbiota is associated with the highest severity (PAI = 5) of periapical lesions (Odds Ratio 4.592, IC 95% [1.6329; 14.0728]; p = 0.001; notably, a lower relative abundance of Burkholderiaceae and a higher relative abundance of Pseudomonas and Prevotella). We also identified that high blood pressure (HBP) is associated with the increase in PAI scores. (4) Conclusions: Our data show that a low diversity of bacterial ecology of the AP is associated with severe PAI scores, suggesting a causal mechanism. Furthermore, a second risk factor was blood pressure associated with the severity of apical periodontitis.
Keywords: apical periodontitis; granuloma; high blood pressure; oral diseases; oral microbiome; periapical index.
Conflict of interest statement
The authors declare that they have no conflict of interest.
Figures
References
-
- Jakovljevic A., Nikolic N., Jacimovic J., Pavlovic O., Milicic B., Beljic-Ivanovic K., Miletic M., Andric M., Milasin J. Prevalence of Apical Periodontitis and Conventional Nonsurgical Root Canal Treatment in General Adult Population: An Updated Systematic Review and Meta-analysis of Cross-sectional Studies Published between 2012 and 2020. J. Endod. 2020;46:1371–1386.e8. doi: 10.1016/j.joen.2020.07.007. - DOI - PubMed
-
- Bănică A.C., Popescu S.M., Mercuţ V., Busuioc C.J., Gheorghe A.G., Traşcă D.M., Brăila A.D., Moraru A.I. Histological and immunohistochemical study on the apical granuloma. Rom. J. Morphol. Embryol. 2018;59:811–817. - PubMed
MeSH terms
Substances
LinkOut - more resources
Full Text Sources
Medical
Miscellaneous
