. 2023 Jan 13;24(2):1631.
doi: 10.3390/ijms24021631.

The Old and the New: Cardiovascular and Respiratory Alterations Induced by Acute JWH-018 Administration Compared to Δ9-THC-A Preclinical Study in Mice

Affiliations

The Old and the New: Cardiovascular and Respiratory Alterations Induced by Acute JWH-018 Administration Compared to Δ9-THC-A Preclinical Study in Mice

Beatrice Marchetti et al. Int J Mol Sci. .

Abstract

Several new psychoactive substances (NPS) are responsible for intoxication involving the cardiovascular and respiratory systems. Among NPS, synthetic cannabinoids (SCs) provoked side effects in humans characterized by tachycardia, arrhythmias, hypertension, breathing difficulty, apnoea, myocardial infarction, and cardiac arrest. Therefore, the present study investigated the cardio-respiratory (MouseOx Plus; EMKA electrocardiogram (ECG) and plethysmography TUNNEL systems) and vascular (BP-2000 systems) effects induced by 1-naphthalenyl (1-pentyl-1H-indol-3-yl)-methanone (JWH-018; 0.3-3-6 mg/kg) and Δ9-tetrahydrocannabinol (Δ9-THC; 0.3-3-6 mg/kg), administered in awake CD-1 male mice. The results showed that higher doses of JWH-018 (3-6 mg/kg) induced deep and long-lasting bradycardia, alternated with bradyarrhythmia, spaced out by sudden episodes of tachyarrhythmias (6 mg/kg), and characterized by ECG electrical parameters changes, sustained bradypnea, and systolic and transient diastolic hypertension. Otherwise, Δ9-THC provoked delayed bradycardia (minor intensity tachyarrhythmias episodes) and bradypnea, also causing a transient and mild hypertensive effect at the tested dose range. These effects were prevented by both treatment with selective CB1 (AM 251, 6 mg/kg) and CB2 (AM 630, 6 mg/kg) receptor antagonists and with the mixture of the antagonists AM 251 and AM 630, even if in a different manner. Cardio-respiratory and vascular symptoms could be induced by peripheral and central CB1 and CB2 receptors stimulation, which could lead to both sympathetic and parasympathetic systems activation. These findings may represent a starting point for necessary future studies aimed at exploring the proper antidotal therapy to be used in SCs-intoxicated patient management.

Keywords: blood pressure; cardiovascular; plethysmography; synthetic cannabinoid.


Conflict of interest statement

The authors declare no conflict of interest.

Figures

Figure 1
Figure 1
Chemical structures of JWH-018 (1-pentyl-3-(1-naphthoyl)indole; panel (A) and Δ9-THC (Δ9-Tetrahydrocannabinol; panel (B) from the Cayman Chemical website (https://www.caymanchem.com, last access on Tuesday 30 November 2021, at 3.30 pm).
Figure 2
Figure 2
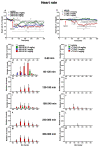
Effect of systemic administration of JWH-018 (0.3–6 mg/kg, panel (A), and ∆9-THC (0.3–6 mg/kg, panel (B)) on heart rate. Data are expressed as percentage of basal values in the form MEAN ± SEM of 6 different evaluations for JWH-018 experiments and MEAN ± SEM of 8 different evaluations for ∆9-THC experiments. Statistical analysis was performed by two-way ANOVA, followed by Bonferroni’s test for multiple comparisons. * p < 0.05 ** p < 0.01 *** p < 0.001 versus vehicle. Vehicle and 6 mg/kg dose curves are marked by letters (a’, b’ for vehicle and a, b 6 mg/kg treatment) to compare effects with ECG electrical parameters (Table 1). Frequency of tachyarrhythmia episodes after administration of JWH-018 (0.3–6 mg/kg, panels (C,E,G,I,K,M) and ∆9-THC (0.3–6 mg/kg, panels (D,F,H,J,L,N), expressed as number of events per mean heart rate value in the form MEAN ± SEM of 6 different evaluations for JWH-018 experiments and MEAN ± SEM of 8 different evaluations for ∆9-THC experiments. Statistical analysis was performed by two-way ANOVA, followed by Bonferroni’s test for multiple comparisons. * p < 0.05 ** p < 0.01 *** p < 0.001 versus vehicle.
Figure 3
Figure 3
ECG track of mice treated with JWH-018 (6 mg/kg) ECG track representing basal (panel (A)), bradycardia (panel (B)), tachycardia (panel (C)) and arrhythmias (panels (D,E)). ECG track of mice treated with ∆9-THC (6 mg/kg). ECG track representing basal (panel (F)), bradycardia (panel (G)), and arrhythmias (panel (H)). Recording was performed with ecgTUNNEL system (Emka Technologies), and tracks was exported after analysis with iox2 software.
Figure 4
Figure 4
Interaction of JWH-018 (6 mg/kg i.p, panel (A)) and ∆9-THC (6 mg/kg i.p, panel (B)) with the selective CB1 receptor antagonist AM 251 (6 mg/kg, i.p.) on heart rate. Data are expressed as percentage of basal values in the form MEAN ± SEM of 8 different evaluations for each group. Statistical analysis was performed by two-way ANOVA, followed by Bonferroni’s test for multiple comparisons. ** p < 0.01 *** p < 0.001 versus vehicle, and # p < 0.05 ### p < 0.001 versus AM 251 + agonists.
Figure 5
Figure 5
Interaction of JWH-018 (6 mg/kg i.p, panel (A)) and ∆9-THC (6 mg/kg i.p, panel (B)) with the selective CB2 receptor antagonist AM 630 (6 mg/kg, i.p.) on heart rate. Interaction of JWH-018 (6 mg/kg i.p, panel (C)) and ∆9-THC (6 mg/kg i.p, panel (D)) with the administration of the mixture of selective CB1 (AM 251; 6 mg/kg, i.p.) and CB2 (AM 630; 6 mg/kg, i.p.) receptor antagonists on heart rate. Data are expressed as percentage of basal values in the form MEAN ± SEM of 8 different evaluations for each group. Statistical analysis was performed by two-way ANOVA, followed by Bonferroni’s test for multiple comparisons. ** p < 0.01 *** p < 0.001 versus vehicle and +++ p < 0.001 versus AM 630 + agonists or AM 630 and AM 251 + agonists.
Figure 6
Figure 6
ECG waves after vehicle and JWH-018 (6 mg/kg) treatment (panel (A)) and ECG waves after vehicle and ∆9-THC (6 mg/kg) treatment (panel (B)). Waves were recorded with ecgTUNNEL system (Emka Technologies) and exported after analysis with iox2 software.
Figure 7
Figure 7
Effect of systemic administration of JWH-018 (0.3–6 mg/kg, panel (A)) and ∆9-THC (0.3–6 mg/kg, panel (B)) on pulse distension. Data are expressed as percentage of basal values in the form MEAN ± SEM of 6 different evaluations for JWH-018 experiments and MEAN ± SEM of 8 different evaluations for JWH-018 experiments. Statistical analysis was performed by two-way ANOVA, followed by Bonferroni’s test for multiple comparisons. ** p < 0.01 *** p < 0.001 versus vehicle. Interaction of JWH-018 (6 mg/kg i.p, panel (C)) and ∆9-THC (6 mg/kg, panel (D)) with the selective CB1 receptor antagonist AM 251 (6 mg/kg, i.p.). Data is expressed as percentage of basal values in the form MEAN ± SEM of 8 different evaluations for each group. Statistical analysis was performed by two-way ANOVA, followed by Bonferroni’s test for multiple comparisons. ** p < 0.01 *** p < 0.001 versus vehicle and # p <0.05, ## p <0.01, ### p < 0.001 versus AM 251 + agonists.
Figure 8
Figure 8
Interaction of JWH-018 (6 mg/kg i.p, panel (A)) and ∆9-THC (6 mg/kg i.p, panel (B)) with the selective CB2 receptor antagonist AM 630 (6 mg/kg, i.p.) on pulse distension. Interaction of JWH-018 (6 mg/kg i.p, panel (C)) and ∆9-THC (6 mg/kg i.p, panel (D)) with the administration of the mixture of selective CB1 (AM 251; 6 mg/kg, i.p.) and CB2 (AM 630; 6 mg/kg, i.p.) receptor antagonists on pulse distension. Data are expressed as percentage of basal values in the form MEAN ± SEM of 8 different evaluations for each group. Statistical analysis was performed by two-way ANOVA, followed by Bonferroni’s test for multiple comparisons ** p < 0.01 *** p < 0.001 versus vehicle and ++ p < 0.01, +++ p < 0.001 versus AM 630 + agonists or AM 630 and AM 251 + agonists.
Figure 9
Figure 9
Effect of systemic administration of JWH-018 (0.3–6 mg/kg on systolic (panel (A)) and diastolic (panel (C))) blood pressure. Data are expressed as absolute values (mm/Hg) in the form MEAN ± SEM of 8 different evaluations for each group. Statistical analysis was performed by two-way ANOVA, followed by Bonferroni’s test for multiple comparisons. ** p < 0.01 *** p < 0.001 versus vehicle. Interaction of JWH-018 (6 mg/kg i.p) with the selective CB1 receptor antagonist AM 251 (6 mg/kg, i.p.) on systolic (panel (B)) and diastolic (panel (D)) blood pressure. Statistical analysis was performed by two-way ANOVA, followed by Bonferroni’s test for multiple comparisons. * p < 0.05 ** p < 0.01 *** p < 0.001 versus vehicle, # p < 0.05, ## p < 0.01, ### p < 0.001 versus AM 251 + agonists.
Figure 10
Figure 10
Effect of systemic administration of ∆9-THC (0.3–6 mg/kg on systolic (panel (A)) and diastolic (panel (B)) blood pressure. Data are expressed as absolute values (mm/Hg) in the form MEAN ± SEM of 8 different evaluations for each group. Statistical analysis was performed by two-way ANOVA, followed by Bonferroni’s test for multiple comparisons. * p < 0.05 ** p < 0.01 versus vehicle.
Figure 11
Figure 11
Interaction of JWH-018 (6 mg/kg i.p) with the selective CB2 receptor antagonist AM 630 (6 mg/kg, i.p.) and with the administration of the mixture of the selective CB2 receptor antagonist AM 630 (6 mg/kg) and AM 251 (6 mg/kg) on systolic (panels (A,B) respectively) and diastolic (panel (C,D), respectively) blood pressure. Statistical analysis was performed by two-way ANOVA, followed by Bonferroni’s test for multiple comparisons. * p < 0.05 ** p < 0.01 *** p < 0.001 versus vehicle and ++ p < 0.01, +++ p < 0.001 versus AM 630 + agonists or AM 630 and AM 251 + agonists.
Figure 12
Figure 12
Effect of systemic administration of JWH-018 (0.3–6 mg/kg, panel (A)) and ∆9-THC (0.3–6 mg/kg, panel (B)) on breath rate. Data are expressed as percentage of basal values in the form MEAN ± SEM of 6 different evaluations for JWH-018 experiments and MEAN ± SEM of 8 different evaluations for ∆9-THC experiments. Statistical analysis was performed by two-way ANOVA, followed by Bonferroni’s test for multiple comparisons. *** p < 0.001 versus vehicle. Vehicle and 6 mg/kg dose curves are marked by letters (a’, b’, and c’ for vehicle and a, b, c, and d for 6 mg/kg treatment) to compare effects with plethysmography electrical parameters (Table 2). Interaction of JWH-018 (6 mg/kg i.p, panel (C)) and ∆9-THC (6 mg/kg i.p, panel (D)) with the selective CB1 receptor antagonist AM 251 (6 mg/kg, i.p.). Data are expressed as percentage of basal values in the form MEAN ± SEM of 8 different evaluations for each group. Statistical analysis was performed by two-way ANOVA, followed by Bonferroni’s test for multiple comparisons. *** p < 0.001 versus vehicle and ### p < 0.001 versus AM 251 + agonists.
Figure 13
Figure 13
Interaction of JWH-018 (6 mg/kg i.p, panel (A)) and ∆9-THC (6 mg/kg i.p, panel (B)) with the selective CB2 receptor antagonist AM 630 (6 mg/kg, i.p.) on breath rate. Interaction of JWH-018 (6 mg/kg i.p, panel (C)) and ∆9-THC (6 mg/kg i.p, panel (D)) with the administration of the mixture of selective CB1 (AM 251; 6 mg/kg, i.p.) and CB2 (AM 630; 6 mg/kg, i.p.) receptor antagonists on breath rate. Data are expressed as percentage of basal values in the form MEAN ± SEM of 8 different evaluations for each group. Statistical analysis was performed by two-way ANOVA, followed by Bonferroni’s test for multiple comparisons *** p < 0.001 versus vehicle, and + p < 0.05, ++ p < 0.01, +++ p < 0.001 versus AM 630 + agonists or AM 630 and AM 251 + agonists.
Figure 14
Figure 14
Effect of systemic administration of JWH-018 (0.3–6 mg/kg, panel (A)) on arterial saturation. Data are expressed as percentage of basal values in the form MEAN ± SEM of 6 different evaluations for JWH-018. Statistical analysis was performed by two-way ANOVA, followed by Bonferroni’s test for multiple comparisons. * p < 0.05 ** p < 0.01 *** p < 0.001 versus vehicle. Interaction of JWH-018 (6 mg/kg i.p.) with the selective CB1 receptor antagonist AM 251 (6 mg/kg, i.p., panel (B)), with the selective CB2 receptor antagonist AM 630 (6 mg/kg, i.p., panel (C)), with the administration of the mixture of AM 630 and AM 251 (panel (D)). Data are expressed as percentage of basal values in the form MEAN ± SEM of 8 different evaluations for each group. Statistical analysis was performed by two-way ANOVA, followed by Bonferroni’s test for multiple comparisons. * p < 0.05 ** p < 0.01 *** p < 0.001 versus vehicle, and ## p < 0.01 versus AM 251 + agonists, and ++ p < 0.01 versus AM 630 + agonists or AM 630 and AM 251 + agonists.

Similar articles

Cited by

References

    1. United Nations Office on Drugs and Crime (UNODC) The Challenge of New Psychoactive Substances: A Report from the Global SMART Programme: Vienna. 2013. [(accessed on 6 June 2022)]. Available online: https://www.unodc.org/documents/scientific/NPS_2013_SMART.pdf.
    1. Schifano F., Napoletano F., Chiappini S., Guirguis A., Corkery J.M., Bonaccorso S., Ricciardi A., Scherbaum N., Vento A. New/emerging psychoactive substances and associated psychopathological consequences. Psychol. Med. 2021;51:30–42. doi: 10.1017/S0033291719001727. - DOI - PubMed
    1. Luethi D., Liechti M.E. Designer drugs: Mechanism of action and adverse effects. Arch. Toxicol. 2020;94:1085–1133. doi: 10.1007/s00204-020-02693-7. - DOI - PMC - PubMed
    1. Fattore L., Fratta W. Beyond THC: The New Generation of Cannabinoid Designer Drugs. Front. Behav. Neurosci. 2011;5:60. doi: 10.3389/fnbeh.2011.00060. - DOI - PMC - PubMed
    1. Zawilska J.B. “Legal Highs”—An Emerging Epidemic of Novel Psychoactive Substances. Int. Rev. Neurobiol. 2015;120:273–300. doi: 10.1016/bs.irn.2015.02.009. - DOI - PubMed