

Episodic Binge-like Ethanol Reduces Skeletal Muscle Strength Associated with Atrophy, Fibrosis, and Inflammation in Young Rats
- PMID: 36675170
- PMCID: PMC9861047
- DOI: 10.3390/ijms24021655
Episodic Binge-like Ethanol Reduces Skeletal Muscle Strength Associated with Atrophy, Fibrosis, and Inflammation in Young Rats
Abstract
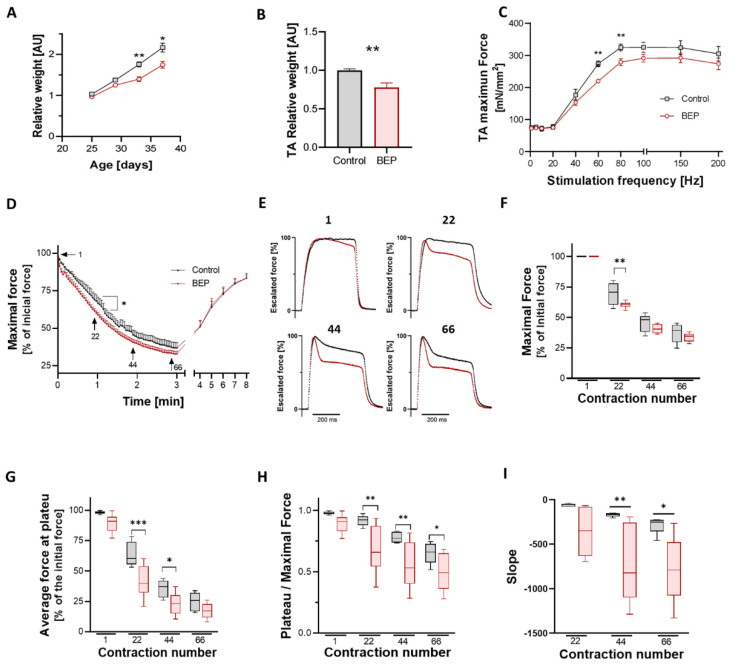
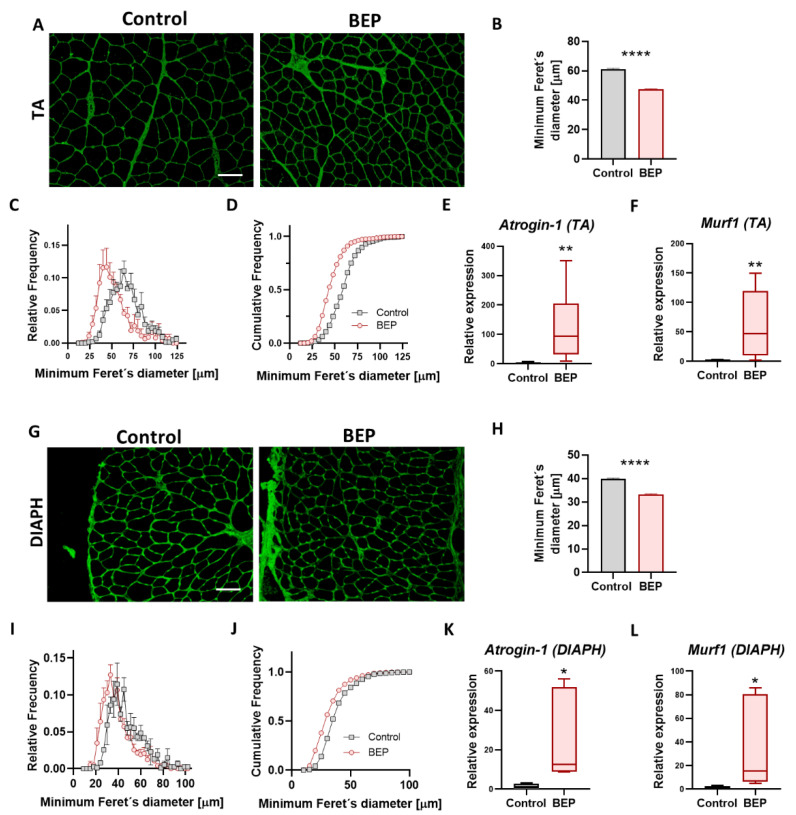
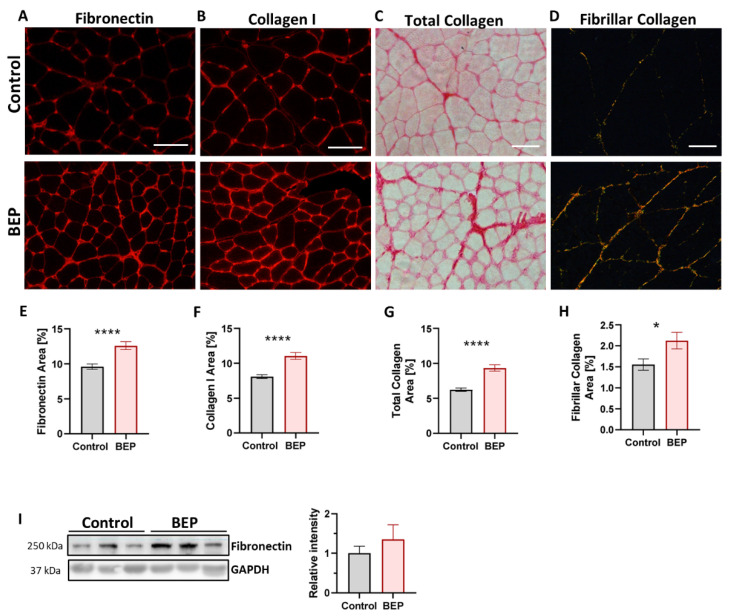
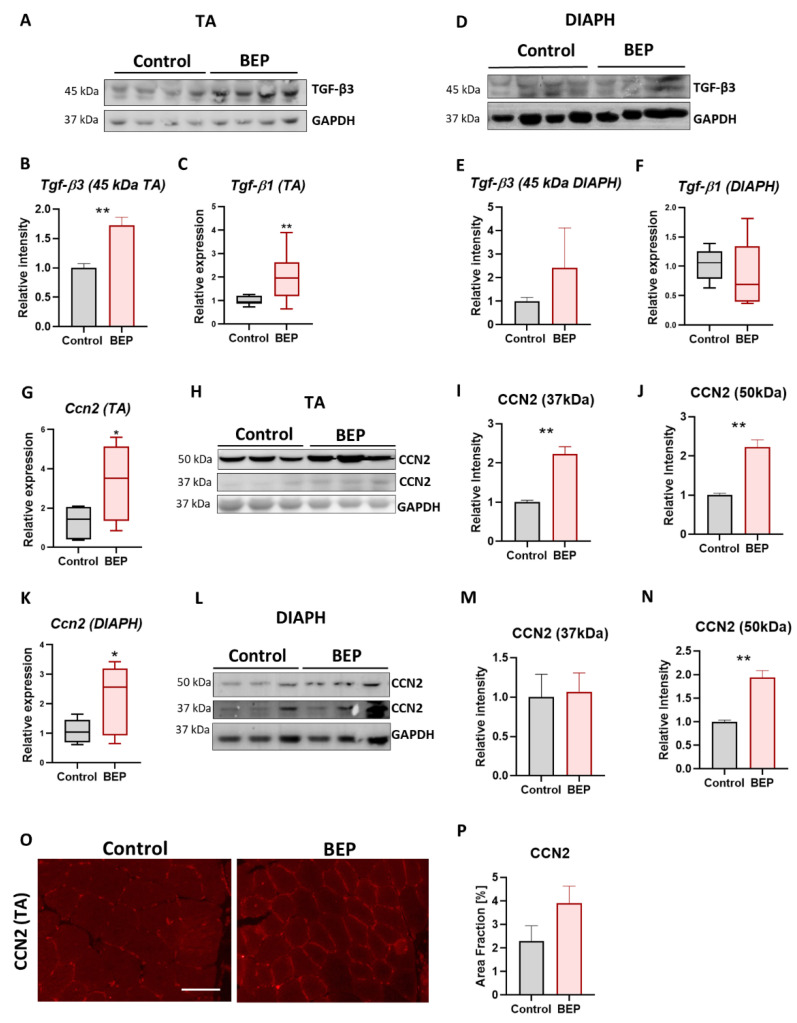
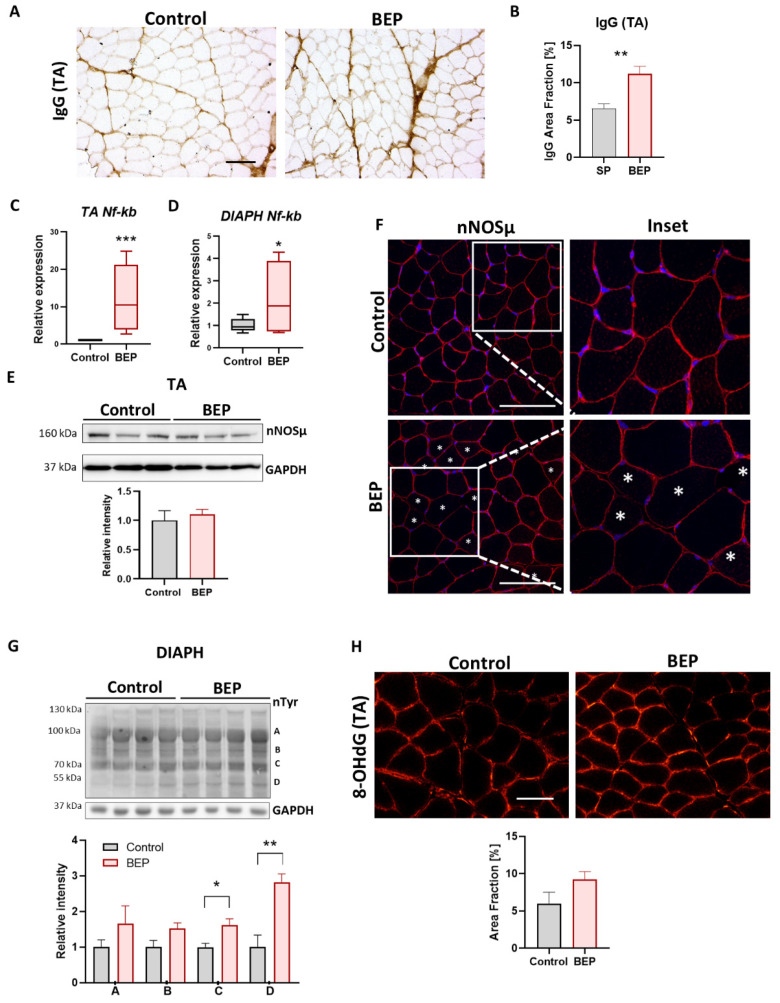
Binge Drinking (BD) corresponds to episodes of ingestion of large amounts of ethanol in a short time, typically ≤2 h. BD occurs across all populations, but young and sports-related people are especially vulnerable. However, the short- and long-term effects of episodic BD on skeletal muscle function have been poorly explored. Young rats were randomized into two groups: control and episodic Binge-Like ethanol protocol (BEP) (ethanol 3 g/kg IP, 4 episodes of 2-days ON-2-days OFF paradigm). Muscle function was evaluated two weeks after the last BEP episode. We found that rats exposed to BEP presented decreased muscle strength and increased fatigability, compared with control animals. Furthermore, we observed that skeletal muscle from rats exposed to BEP presented muscle atrophy, evidenced by reduced fiber size and increased expression of atrophic genes. We also observed that BEP induced fibrotic and inflammation markers, accompanied by mislocalization of nNOSµ and high levels of protein nitration. Our findings suggest that episodic binge-like ethanol exposure alters contractile capacity and increases fatigue by mechanisms involving atrophy, fibrosis, and inflammation, which remain for at least two weeks after ethanol clearance. These pathological features are common to several neuromuscular diseases and might affect muscle performance and health in the long term.
Keywords: CCN2/CTGF; alcohol; alcoholic myopathy; atrophy; binge-drinking; ethanol; fibrosis; muscle fatigue; skeletal muscle.
Conflict of interest statement
The authors declare no conflict of interest.
Figures
Similar articles
-
The functional and molecular effects of problematic alcohol consumption on skeletal muscle: a focus on athletic performance.Am J Drug Alcohol Abuse. 2022 Mar 4;48(2):133-147. doi: 10.1080/00952990.2022.2041025. Epub 2022 Apr 7. Am J Drug Alcohol Abuse. 2022. PMID: 35389308 Review.
-
The Influence of Stress and Binge-Patterned Alcohol Drinking on Mouse Skeletal Muscle Protein Synthesis and Degradation Pathways.Biomolecules. 2024 Apr 28;14(5):527. doi: 10.3390/biom14050527. Biomolecules. 2024. PMID: 38785934 Free PMC article.
-
Binge drinking leads to an oxidative and metabolic imbalance in skeletal muscle during adolescence in rats: endocrine repercussion.J Physiol Biochem. 2023 Nov;79(4):799-810. doi: 10.1007/s13105-023-00983-z. Epub 2023 Sep 7. J Physiol Biochem. 2023. PMID: 37676577 Free PMC article.
-
Skeletal muscle satellite cell-derived mesenchymal stem cells ameliorate acute alcohol-induced liver injury.Int J Med Sci. 2022 Jan 24;19(2):353-363. doi: 10.7150/ijms.68971. eCollection 2022. Int J Med Sci. 2022. PMID: 35165521 Free PMC article.
-
The importance of alcohol-induced muscle disease.J Muscle Res Cell Motil. 2003;24(1):55-63. doi: 10.1023/a:1024842817060. J Muscle Res Cell Motil. 2003. PMID: 12953836 Review.
Cited by
-
Highlights in Pathophysiology of the Musculoskeletal System.Int J Mol Sci. 2023 Mar 29;24(7):6412. doi: 10.3390/ijms24076412. Int J Mol Sci. 2023. PMID: 37047383 Free PMC article.
-
Role of nutrition in patients with coexisting chronic obstructive pulmonary disease and sarcopenia.Front Nutr. 2023 Aug 8;10:1214684. doi: 10.3389/fnut.2023.1214684. eCollection 2023. Front Nutr. 2023. PMID: 37614743 Free PMC article. Review.
-
Lactobacillus fermentum LF31 Supplementation Reversed Atrophy Fibers in a Model of Myopathy Through the Modulation of IL-6, TNF-α, and Hsp60 Levels Enhancing Muscle Regeneration.Nutrients. 2025 Apr 30;17(9):1550. doi: 10.3390/nu17091550. Nutrients. 2025. PMID: 40362856 Free PMC article.
-
Alcohol Impairs Bioenergetics and Differentiation Capacity of Myoblasts from Simian Immunodeficiency Virus-Infected Female Macaques.Int J Mol Sci. 2024 Feb 19;25(4):2448. doi: 10.3390/ijms25042448. Int J Mol Sci. 2024. PMID: 38397125 Free PMC article.
References
-
- WHO . Global Status Report on Alcohol and Health. World Health Organization; Geneva, Switzerland: 2018.
MeSH terms
Substances
Grants and funding
LinkOut - more resources
Full Text Sources
Miscellaneous
