. 2023 Jan 15;24(2):1694.
doi: 10.3390/ijms24021694.

Nebulized Menthol Impairs Mucociliary Clearance via TRPM8 and MUC5AC/MUC5B in Primary Airway Epithelial Cells

Affiliations

Nebulized Menthol Impairs Mucociliary Clearance via TRPM8 and MUC5AC/MUC5B in Primary Airway Epithelial Cells

Nathalie Baumlin et al. Int J Mol Sci. .

Abstract

Flavorings enhance the palatability of e-cigarettes (e-cigs), with menthol remaining a popular choice among e-cig users. Menthol flavor remains one of the only flavors approved by the United States FDA for use in commercially available, pod-based e-cigs. However, the safety of inhaled menthol at the high concentrations used in e-cigs remains unclear. Here, we tested the effects of menthol on parameters of mucociliary clearance (MCC) in air-liquid interface (ALI) cultures of primary airway epithelial cells. ALI cultures treated with basolateral menthol (1 mM) showed a significant decrease in ciliary beat frequency (CBF) and airway surface liquid (ASL) volumes after 24 h. Menthol nebulized onto the surface of ALI cultures similarly reduced CBF and increased mucus concentrations, resulting in decreased rates of mucociliary transport. Nebulized menthol further increased the expression of mucin 5AC (MUC5AC) and mRNA expression of the inflammatory cytokines IL1B and TNFA. Menthol activated TRPM8, and the effects of menthol on MCC and inflammation could be blocked by a specific TRPM8 antagonist. These data provide further evidence that menthol at the concentrations used in e-cigs could cause harm to the airways.

Keywords: MUC5AC; MUC5B; TRPM8; airway epithelium; menthol.


Conflict of interest statement

The authors declare no conflict of interest.

Figures

Figure 1
Figure 1
Menthol induces a Ca2+ response in primary HBEC via TRPM8. (A) Expression levels of TRPM8 mRNA analyzed by ddPCR in HBEC treated with basolateral DMSO (0.1%) or menthol (1 mM) for 24 h. (B,C) Maximum (B) and area under the curve (AUC) (C) fluorescence changes caused by menthol (0.1, 0.3, 1.0, and 3.0 mM) in GCaMP6s-expressing HBEC. n ≥ 3, ≥2 lungs. (D) Representative tracing of GCaMP6s emission over time in HBEC exposed to menthol ± AMTB. (E,F) Maximum Ca2+ response (E) and AUC (F) fluorescence changes caused by menthol (1 mM) ± AMTB (30 µM). n = 4, 2 lungs. Statistics: Data shown as mean ± SEM. * p < 0.05, paired (A) or unpaired (E,F) t-test after assessing normality with Shapiro–Wilk.
Figure 2
Figure 2
Effects of basolateral menthol on CBF and ASL volumes in primary HBEC. (A) CBF measured at 0 h and 24 h in HBEC treated with basolateral DMSO (0.1%) or menthol (0.3 mM). n = 16–20, 4 lungs. (B) CBF measured at 0 h and 24 h in HBEC treated with basolateral DMSO (0.1%) or menthol (1 mM). n = 52–55, 6 lungs. (C) ASL volume measured at 0 h and 24 h in HBEC treated with basolateral DMSO (0.1%) or menthol (1 mM). ASL volumes are normalized to baselines (0 h). n = 13, 8 lungs. Statistics: Data shown as mean ± SEM. * p < 0.05, two-way ANOVA followed by Holm–Sidak.
Figure 3
Figure 3
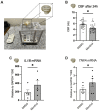
Effects of nebulized menthol on CBF and the expression of inflammatory markers in primary HBEC. All measurements were recorded 24 h after nebulization of DMSO (~0.1% final in the ASL, control) and menthol (~1 mM). (A) Cloud system with nebulizer. (B) CBF measured 24 h after menthol nebulization and DMSO control. n = 23, 5 lungs. (C) IL1B mRNA expression. n = 5, 3 lungs. (D) TNFA mRNA expression. n = 6, ≥3 lungs. Statistics: Data shown as mean ± SEM. * p < 0.05, mixed model analysis (B) or paired t–test (C,D) after assessing normality with Shapiro–Wilk.
Figure 4
Figure 4
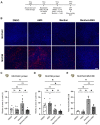
Effects of nebulized menthol and a TRPM8 antagonist on mucin expression in primary HBEC. (A) Schema of experimental design. All measurements were recorded 24 h after nebulization of DMSO (~0.1% final in the ASL, control) and menthol (~1 mM) with or without the TRPM8 antagonist AMG333 (~100 nM final in the ASL and 100 nM in the basolateral media). (B) Representative confocal images of MUC5AC and MUC5B (in red) as well as nuclei (Hoechst in blue). Scale bar represents 50 μm. (C,D) Quantification of expression of MUC5AC and MUC5B expressed as a ratio of surface area labeling of MUC5AC/Hoechst (C) and MUC5B/Hoechst (D), respectively. n = 9, 3 lungs. (E) Ratio of MUC5AC to MUC5B protein expression. n = 3 lungs. Statistics: Data shown as mean ± SEM. * p < 0.05, two–way ANOVA followed by Holm–Sidak (B,C) or one–way ANOVA followed by Holm–Sidak (D) after assessing normality with Shapiro–Wilk.
Figure 5
Figure 5
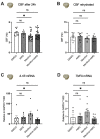
Effects of a TRPM8 antagonist on menthol-induced reductions in CBF and increases in IL1B and TNFA mRNA expressions. All assays were recorded 24 h after nebulization of DMSO (~0.1% final in the ASL, control) and menthol (~1 mM) with or without AMG333 (~100 nM final in the ASL and 100 nM in the basolateral media). (A) CBF measurements after nebulization of menthol and AMG333. N = 10–29, 2–6 lungs. (B) CBF measurements after rehydrating the surface of cultures with PBS. N = 9, 3 lungs. (C,D) Expression levels of IL1B (C) and TNFA (D) mRNAs. N = 7, 3 lungs. Statistics: Data shown as mean ± SEM. * p < 0.05 compared to DMSO control, two–way ANOVA followed by Dunnett (A,B) and one–way ANOVA followed by Dunnett (C,D).
Figure 6
Figure 6
Effects of a TRPM8 antagonist on menthol-induced reductions in parameters of MCC. All measurements were recorded 24 h after nebulization of DMSO (~0.1% final in the ASL, control) and menthol (~1 mM) with or without AMG333 (~100 nM final in the ASL, and 100 nM in the basolateral media). (A) Percent mucus solids measured using a mesh. n ≥ 8 from 4 lungs. (B) Mucociliary transport measured with fluorescent beads. n ≥ 9 from 4 lungs. Statistics: Data shown as mean ± SEM. * p < 0.05 compared to DMSO control, two–way ANOVA followed by Dunnett (A) and one-way ANOVA followed by Dunnett (B).

References

    1. Sassano M.F., Davis E.S., Keating J.E., Zorn B.T., Kochar T.K., Wolfgang M.C., Glish G.L., Tarran R. Evaluation of e-liquid toxicity using an open-source high-throughput screening assay. PLoS Biol. 2018;16:e2003904. doi: 10.1371/journal.pbio.2003904. - DOI - PMC - PubMed
    1. Clapp P.W., Lavrich K.S., van Heusden C.A., Lazarowski E.R., Carson J.L., Jaspers I. Cinnamaldehyde in flavored e-cigarette liquids temporarily suppresses bronchial epithelial cell ciliary motility by dysregulation of mitochondrial function. Am. J. Physiol. Lung. Cell. Mol. Physiol. 2019;316:L470–L486. doi: 10.1152/ajplung.00304.2018. - DOI - PMC - PubMed
    1. Sherwood C.L., Boitano S. Airway epithelial cell exposure to distinct e-cigarette liquid flavorings reveals toxicity thresholds and activation of CFTR by the chocolate flavoring 2,5-dimethypyrazine. Respir. Res. 2016;17:57. doi: 10.1186/s12931-016-0369-9. - DOI - PMC - PubMed
    1. Muthumalage T., Lamb T., Friedman M.R., Rahman I. E-cigarette flavored pods induce inflammation, epithelial barrier dysfunction, and DNA damage in lung epithelial cells and monocytes. Sci. Rep. 2019;9:19035. doi: 10.1038/s41598-019-51643-6. - DOI - PMC - PubMed
    1. Park H.R., O’Sullivan M., Vallarino J., Shumyatcher M., Himes B.E., Park J.A., Christiani D.C., Allen J., Lu Q. Transcriptomic response of primary human airway epithelial cells to flavoring chemicals in electronic cigarettes. Sci. Rep. 2019;9:1400. doi: 10.1038/s41598-018-37913-9. - DOI - PMC - PubMed

MeSH terms

LinkOut - more resources