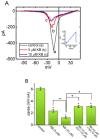
. 2023 Jan 16;24(2):1805.
doi: 10.3390/ijms24021805.

Inhibition of Voltage-Gated Na+ Currents Exerted by KB-R7943 (2-[2-[4-(4-nitrobenzyloxy)phenyl]ethyl]isothiourea), an Inhibitor of Na+-Ca2+ Exchanging Process

Affiliations

Inhibition of Voltage-Gated Na+ Currents Exerted by KB-R7943 (2-[2-[4-(4-nitrobenzyloxy)phenyl]ethyl]isothiourea), an Inhibitor of Na+-Ca2+ Exchanging Process

Sheng-Nan Wu et al. Int J Mol Sci. .

Abstract

KB-R7943, an isothiourea derivative, has been recognized as an inhibitor in the reverse mode of the Na+-Ca2+ exchanging process. This compound was demonstrated to prevent intracellular Na+-dependent Ca2+ uptake in intact cells; however, it is much less effective at preventing extracellular Na+-dependent Ca2+ efflux. Therefore, whether or how this compound may produce any perturbations on other types of ionic currents, particularly on voltage-gated Na+ current (INa), needs to be further studied. In this study, the whole-cell current recordings demonstrated that upon abrupt depolarization in pituitary GH3 cells, the exposure to KB-R7943 concentration-dependently depressed the transient (INa(T)) or late component (INa(L)) of INa with an IC50 value of 11 or 0.9 μM, respectively. Likewise, the dissociation constant for the KB-R7943-mediated block of INa on the basis of a minimum reaction scheme was estimated to be 0.97 μM. The presence of benzamil or amiloride could suppress the INa(L) magnitude. The instantaneous window Na+ current (INa(W)) activated by abrupt ascending ramp voltage (Vramp) was suppressed by adding KB-R7943; however, subsequent addition of deltamethrin or tefluthrin (Tef) effectively reversed KB-R7943-inhibted INa(W). With prolonged duration of depolarizing pulses, the INa(L) amplitude became exponentially decreased; moreover, KB-R7943 diminished INa(L) magnitude. The resurgent Na+ current (INa(R)) evoked by a repolarizing Vramp was also suppressed by adding this compound; moreover, subsequent addition of ranolazine or Tef further diminished or reversed, respectively, its reduction in INa(R) magnitude. The persistent Na+ current (INa(P)) activated by sinusoidal voltage waveform became enhanced by Tef; however, subsequent application of KB-R7943 counteracted Tef-stimulated INa(P). The docking prediction reflected that there seem to be molecular interactions of this molecule with the hNaV1.2 or hNaV1.7 channels. Collectively, this study highlights evidence showing that KB-R7943 has the propensity to perturb the magnitude and gating kinetics of INa (e.g., INa(T), INa(L), INa(W), INa(R), and INa(P)) and that the NaV channels appear to be important targets for the in vivo actions of KB-R7943 or other relevant compounds.

Keywords: KB-R7943; Na+-Ca2+ exchange; current kinetics; late Na+ current; persistent Na+ current; resurgent Na+ current; transient Na+ current; voltage-gated Na+ current; window Na+ current.


Conflict of interest statement

No conflicts of interest, financial or otherwise, are declared by the author(s). The content and writing of this paper are solely the responsibility of the authors.

Figures
Figure 1
Figure 1
Inhibitory effect of KB−R7943 on voltage-gated Na+ current (INa) identified from pituitary GH3 cells. The whole−cell current recordings were conducted in cells bathed in Ca2+−free Tyrode solution containing 10 mM tetraethylammonium chloride (TEA) and 0.5 mM CdCl2, and we filled up the measuring electrode with a solution containing Cs+. (A) Exemplar current traces obtained during control period (a, black color) and in the presence of 1 μM KB−R7943 (b, pink color, KB) or 3 μM KB−R7943 (c, red color, KB). The upper part shown the voltage clamp protocol given; graphs on the right side of (A) with dashed curve arrows show the expanded records from each purple broken box in the left side. (B) Concentration-response curve of KB−R7943−mediated inhibition of transient (peak) INa (INa(T)) (open red squares) or late (sustained) INa (INa(L)) (filled blue circles) observed in GH3 cells. The smooth blue or red line drawn represents the goodness-of-fit to the modified Hill equation, as elaborated in Section 4. The IC50 value for KB-R7943-induced inhibition of INa(T) or INa(L) seen in these cells was yielded to be 11 or 0.9 μM, respectively. Each point represents the mean ± SEM (n = 8−9).
Figure 2
Figure 2
Effect of benzamil, amiloride, benzamil plus tefluthrin (Tef), and benzamil plus deltamethrin (DLT) on INa measured from GH3 cells. (A) Exemplar current traces elicited by rectangular depolarizing pulse from −80 to −10 mV for a duration of 40 ms. a: control (black color); b: in the presence of 10 μM benzamil (b, red color). The uppermost part is the voltage clamp protocol delivered, and the lower part of (A) shows the display of the expanded records in each purple dashed box. (B) Summary graph demonstrating effects of benzamil, amiloride, benzamil plus tefluthrin (Tef), and benzamil plus deltamethrin (DLT) on the amplitude of INa(L) (mean ± SEM; n = 7 for each yellow bar). The INa(L) amplitude was measured at the end of a short depolarizing pulse from −80 to −10 mV for a duration of 40 ms. * Significantly different from control (p < 0.05) and ** significantly different from benzamil (10 μM) alone group (p < 0.05).
Figure 3
Figure 3
Effect of KB−R7943 on INa(T) evoked by different levels of depolarizing voltage commands measured from GH3 cells. Average current versus voltage (IV) relationships of peak amplitude of INa(T) under control (filled black squares) and during the exposure to 3 μM KB-R7943 (open red squares). Each cell was depolarized from −80 mV to various potentials ranging from −80 to +40 mV in 10 mV increments for a duration of 30 ms. The INa(T) amplitude was measured at the beginning of each voltage pulse. Each point represents the mean ± SEM (n = 7).
Figure 4
Figure 4
Inhibitory effect of KB-R7943 on nonlinear window INa (INa(W)) activated by abrupt ascend−ng ramp voltage (Vramp) in GH3 cells. This set of whole−cell current recordings was undertaken with the tested cell voltage-clamped at −80 mV, and we then applied Vramp from −100 to +50 mV for a duration of 150 ms on the cell. (A) Exemplar current traces were acquired during the control period (a, black color) and in the presence of 3 μM KB-R7943 (b, red color, KB) or 10 μM KB−R7943 (c, purple color, KB). The voltage clamp protocol applied is shown in the inset, whereas a downward deflection is indicated as the appearance of transient inward current (i.e., instantaneous INa(W)) in response to short ascending Vramp. (B) Summary bar graph showing the effect of KB−R7943 (KB, 3 or 10 μM), KB-R7943 plus deltamethrin (DLT), and KB−R7943 plus tefluthrin (Tef) on the ∆area of INa(W) (mean ± SEM; n = 8 for each green bar). The ∆area of INa(W) (i.e., the relationship of membrane voltage versus current amplitude) was calculated at the area encircled under the voltages ranging between −90 and +40 mV during the short upsloping Vramp. * Significantly different from control (p < 0.05), ** significantly different from KB-R7943 (3 μM) alone group (p < 0.05), and + significantly different from KB−R7943 (10 μM) alone group (p < 0.05).
Figure 5
Figure 5
Effect of KB−R7943 on both recovery of INa(L) (A) and INa(L) magnitude evoked by the envelope−of−tail test (B) seen in GH3 cells. (A) Exemplar current traces taken during the control period (a, absence of KB-R7943) and with presence of 3 μM KB−R7943 (b). Different colors represent the specific current trace evoked by the voltage pulse with increasing duration at the level of −10 mV. The panels shown on the right side denote the expanded records from purple dashed boxes with solid curve arrows on the left side for better illustrations. (B) Relationship of the duration of depolarizing pulse versus the INa(L) amplitude at −50 mV acquired in the absence (filled black squares) and presence (open red circles) of 3 μM KB−R7943 (mean ± SEM; n = 7 for each point). Current amplitude was measured at the end of voltage pulse at the level of −50 mV, and the absolute value of current amplitude is illustrated. (C) KB−R7943−mediated changes in INa(L) amplitude evoked by the envelope−of−tail test (mean ± SEM; n = 7 for each point). The relationships of the pulse duration versus the relative amplitude of INa(L) are illustrated with or without cell exposure to 3 μM KB−R7943. The relative amplitude appearing at the y−axis was measured in situations where INa(L) amplitude at the end of depolarizing pulse from −100 to −10 mV was divided by the tail current at the end of the voltage step taken following a return to −50 mV. The decaying rate of INa(L) evoked during the envelope−of−tail occurred in a single exponential function.
Figure 6
Figure 6
Inhibitory effect of KB−7943 on instantaneous resurgent Na+ current (INa(R)) identified from GH3 cells. The experiments used to evoke non-linear INa(R) were designed to consist of a conditioning pulse step from −80 to +30 mV with a duration of 30 ms followed by a 1 s descending Vramp from +30 to −80 mV (i.e., ramp pulse of −0.11 mV/ms). (A) Exemplar relationship of the current amplitude versus the membrane potential taken in the control period (a, black color) and during exposure to 3 μM KB−7943 (b, red color). Inset shows the voltage clamp protocol applied. (B) Summary graph disclosing effects of KB−7943 (KB, 1 or 3 μM), KB−7943 plus ranolazine (Ran), and KB−7943 plus tefluthrin (Tef) on the amplitude of INa(R) in response to the descending (repolarizing) Vramp (mean ± SEM; n = 7 for each yellow bar). Each current amplitude evoked by the downsloping Vramp was taken at the level of −5 mV. * Significantly different from control (p < 0.05), ** significantly different from KB-7943 (1 μM) alone group (p < 0.05), and + significantly different from KB−7943 (3 μM) alone group (p < 0.05).
Figure 7
Figure 7
Attenuating effect of KB−R7943 on tefluthrin-stimulated INa(P) activated in response to sinusoidal voltage waveform. The tested cell was held at −80 mV, and the voltage clamp protocol designed to consist of sinusoidal voltages between −100 and 0 mV with a rate of 5 Hz for a duration of 1 sec was afterwards applied to it. (A) Exemplar current traces obtained in the control period (a, black color, i.e., neither Tef nor KB (KB−7943) was present), and during cell exposure to either 10 μM Tef (b, orange color) or 10 μM Tef plus 3 μM KB−R7943 (c, purple color). The asterisk in each panel indicates a transient inward deflection corresponding with the occurrence of INa(P) activated in response to sinusoidal voltage waveform. (B) Effect of tefluthrin (Tef) and Tef plus KB−R7943 (KB, 1 or 3 μM) on ∆current amplitude of INa(P) activated in response to sinusoidal voltage command (mean ± SEM; n = 7 for each brown bar). The absolute value of ∆current amplitude of INa(P) shown on the y-axis was measured when the difference between current amplitude at −60 mV and that at −30 mV was taken. * Significantly different from control (p < 0.05), ** significantly different from Tef (10 μM) alone group (p < 0.05), + significantly different from Tef (10 μM) plus KB (1 μM) group (p < 0.05).
Figure 8
Figure 8
Molecular docking of the hNaV1.7 channel and the KB-R7943 molecule. The chemical structure of KB-R7943 was acquired from PubChem (compound CID: 9823846), whereas the protein structure of hNaV1.7 was from RCB PDB (ID: 5EK0). We docked the KB-R7943 molecule to hNaV1.7 with the help of PyRx software (http://pyrx.sourceforge.io/) (accessed on 16 September 2022), and the diagram of the interaction between the hNaV1.7 channel and the KB-R7943 molecule was then generated from LigPlot+ (http://www.ebi.ac.uk/thornton-srv/software/LIGPLOT/) (accessed on 16 September 2022). Note that the red arcs on which red small bars are faced and radiated toward the ligand (i.e., KB-R7943 molecule) represent the hydrophobic interactions, while green dotted lines residing in amino acid residue (i.e., Ser1681(B), Ser1681(C), Thr1709(C) and Met1877(C)) show the formation of hydrogen bonds.
Figure 9
Figure 9
Molecular docking of the hNaV1.2 channel and the KB-R7943 molecule. The chemical structure of KB-R7943 was taken from PubChem (compound CID: 9823846), whereas the protein structure of hNaV1.2 was from RCB PDB (ID: 2KAV). We docked the KB-R7943 molecule to hNaV1.2 with PyRx, and diagram of the interaction between the hNaV1.2 channel and the KB-R7943 molecule was then generated from LigPlot+. Similar to those on the right side of Figure 8, the red arcs on which red small bars are faced and radiated toward the KB-R7943 molecule represent the hydrophobic interactions, whereas green dotted lines in amino acid residue (i.e., Glu1788(A) and Thr1862(A)) indicate the formation of hydrogen bonds.

Similar articles

Cited by

References

    1. Campbell D.L., Giles W.R., Robinson K., Shibata E.F. Studies of the sodium-calcium exchanger in bull-frog atrial myocytes. J. Physiol. 1988;403:317–340. doi: 10.1113/jphysiol.1988.sp017251. - DOI - PMC - PubMed
    1. Giles W., Shimoni Y. Comparison of sodium-calcium exchanger and transient inward currents in single cells from rabbit ventricle. J. Physiol. 1989;417:465–481. doi: 10.1113/jphysiol.1989.sp017813. - DOI - PMC - PubMed
    1. Clark R.B., Bouchard R.A., Giles W.R. Action potential duration modulates calcium influx, Na(+)-Ca2+ exchange, and intracellular calcium release in rat ventricular myocytes. Ann. N. Y. Acad. Sci. 1996;779:417–429. doi: 10.1111/j.1749-6632.1996.tb44817.x. - DOI - PubMed
    1. Morales A., Lachuer J., Bilbaut A., Georges B., Andrieu J.L., Diez J., Ojeda C. Characterization of a Na+-Ca2+ exchanger NCX1 isoform in bovine fasciculata cells of adrenal gland. Mol. Cell. Biochem. 2001;218:41–45. doi: 10.1023/A:1007289902405. - DOI - PubMed
    1. Sung R.J., Wu Y.H., Lai N.H., Teng C.H., Luo C.H., Tien H.C., Lo C.P., Wu S.N. Beta-adrenergic modulation of arrhythmogenesis and identification of targeted sites of antiarrhythmic therapy in Timothy (LQT8) syndrome: A theoretical study. Am. J. Physiol. Heart Circ. Physiol. 2010;298:H33–H44. doi: 10.1152/ajpheart.00232.2009. - DOI - PubMed

MeSH terms

Substances

LinkOut - more resources