

Electrocardiographic Time-Intervals Waveforms as Potential Predictors for Severe Acute Kidney Injury in Critically Ill Patients
- PMID: 36675629
- PMCID: PMC9866689
- DOI: 10.3390/jcm12020700
Electrocardiographic Time-Intervals Waveforms as Potential Predictors for Severe Acute Kidney Injury in Critically Ill Patients
Abstract
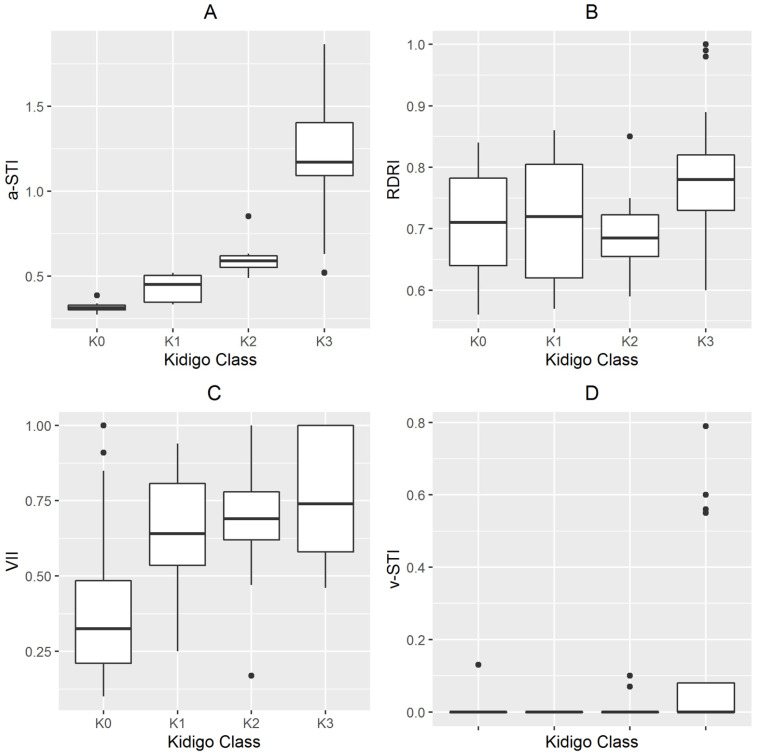
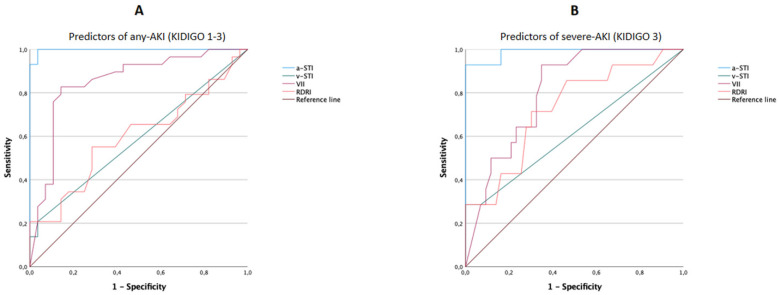
Background: Acute kidney injury (AKI) is common in critically ill patients admitted to intensive care units (ICU) and is frequently associated with poorer outcomes. Hence, if an indicator is available for predicting severe AKI within the first few hours of admission, management strategies can be put into place to improve outcomes. Materials and methods: This was a prospective, observational study, involving 63 critically ill patients, that aimed to explore the diagnostic accuracy of different Doppler parameters in predicting AKI in critically ill patients from a mixed ICU. Participants were enrolled at ICU admission. All underwent ultrasonographic examinations and hemodynamic assessment. Renal Doppler resistive index (RDRI), venous impedance index (VII), arterial systolic time intervals (a-STI), and venous systolic time intervals (v-STI) were measured within 2 h from ICU admission. Results: Cox proportional hazards models, including a-STI, v-STI, VII, and RDRI as independent variables, returned a-STI as the only putative predictor for the development of AKI or severe AKI. An overall statistically significant difference (p < 0.001) was observed in the Kaplan−Meier plots for cumulative AKI events between patients with a-STI higher or equal than 0.37 and for cumulative severe AKI-3 between patients with a-STI higher or equal than 0.63. As assessed by the area under the receiver operating curves (ROC) curves, a-STI performed best in diagnosing any AKI and/or severe AKI-3. Positive correlations were found between a-STI and the N-terminal brain natriuretic peptide precursor (NT-pro BNP) (ρ = 0.442, p < 0.001), the sequential organ failure assessment (SOFA) score (ρ: 0.361, p = 0.004), and baseline serum creatinine (ρ: 0.529, p < 0.001). Conclusions: Critically ill patients who developed AKI had statistically significant different a-STI (on admission to ICU), v-STI, and VII than those who did not. Moreover, a-STI was associated with the development of AKI at day 5 and provided the best diagnostic accuracy for the diagnosis of any AKI or severe AKI compared with RDRI, VII, and v-STI.
Keywords: acute kidney disease; hypoperfusion; renal Doppler resistive index; renal ultrasonography; splanchnic congestion; venous impedance index.
Conflict of interest statement
The authors declare that they have no conflict of interests with the subject of the article.
Figures


References
-
- Grams M.E., Sang Y., Coresh J., Ballew S., Matsushita K., Molnar M.Z., Szabo Z., Kalantar-Zadeh K., Kovesdy C.P. Acute kidney injury after major surgery: A retrospective analysis of veterans health administration data. Am. J. Kidney Dis. 2016;67:872–880. doi: 10.1053/j.ajkd.2015.07.022. - DOI - PMC - PubMed
-
- Chawla L.S., Bellomo R., Bihorac A., Goldstein S.L., Siew E.D., Bagshaw S.M., Bittleman D., Cruz D., Endre Z., Fitzgerald R.L., et al. Acute kidney disease and renal Recovery: Consensus report of the acute disease quality initiative (ADQI) 16 Workgroup. Nat. Rev. Nephrol. 2017;13:241–257. doi: 10.1038/nrneph.2017.2. - DOI - PubMed
LinkOut - more resources
Full Text Sources
Research Materials
