

Exploring Genetic and Neural Risk of Specific Reading Disability within a Nuclear Twin Family Case Study: A Translational Clinical Application
- PMID: 36675818
- PMCID: PMC9862148
- DOI: 10.3390/jpm13010156
Exploring Genetic and Neural Risk of Specific Reading Disability within a Nuclear Twin Family Case Study: A Translational Clinical Application
Abstract
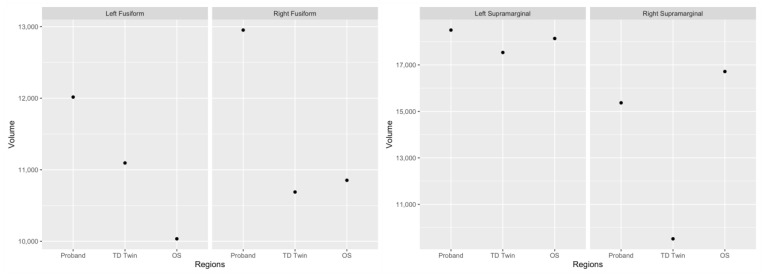
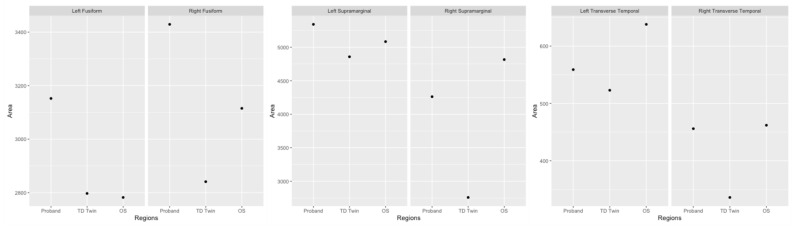
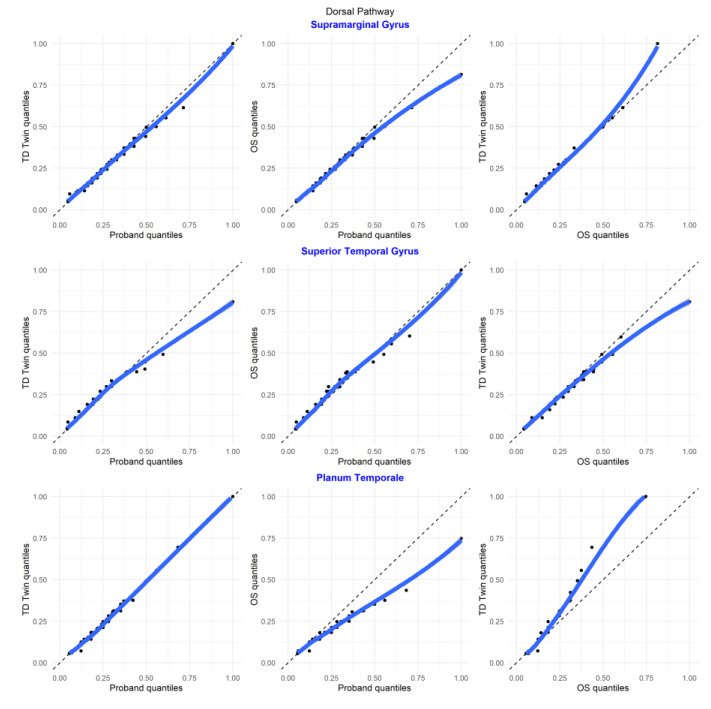
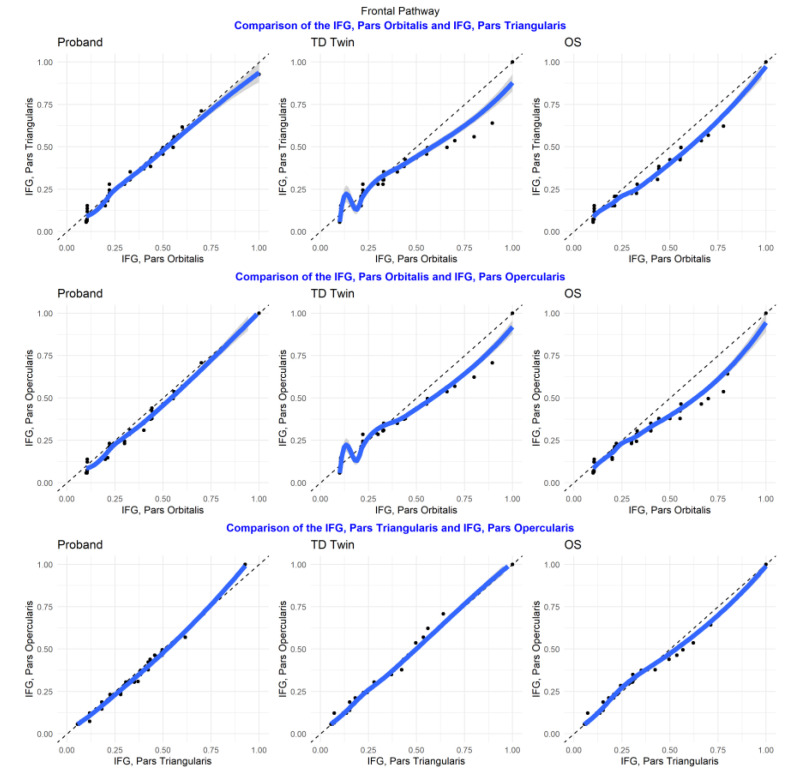
Imaging and genetic studies have characterized biological risk factors contributing to specific reading disability (SRD). The current study aimed to apply this literature to a family of twins discordant for SRD and an older sibling with reading difficulty. Intraclass correlations were used to understand the similarity of imaging phenotypes between pairs. Reading-related genes and brain region phenotypes, including asymmetry indices representing the relative size of left compared to right hemispheric structures, were descriptively examined. SNPs that corresponded between the SRD siblings and not the typically developing (TD) siblings were in genes ZNF385D, LPHN3, CNTNAP2, FGF18, NOP9, CMIP, MYO18B, and RBFOX2. Imaging phenotypes were similar among all sibling pairs for grey matter volume and surface area, but cortical thickness in reading-related regions of interest (ROIs) was more similar among the siblings with SRD, followed by the twins, and then the TD twin and older siblings, suggesting cortical thickness may differentiate risk for this family. The siblings with SRD had more symmetry of cortical thickness in the transverse temporal and superior temporal gyri, while the TD sibling had greater rightward asymmetry. The TD sibling had a greater leftward asymmetry of grey matter volume and cortical surface area in the fusiform, supramarginal, and transverse temporal gyrus. This exploratory study demonstrated that reading-related risk factors appeared to correspond with SRD within this family, suggesting that early examination of biological factors may benefit early identification. Future studies may benefit from the use of polygenic risk scores or machine learning to better understand SRD risk.
Keywords: genetics; neuroimaging; reading disability.
Conflict of interest statement
The authors declare no conflict of interest.
Figures


Similar articles
-
Neuroimaging genetic associations between SEMA6D, brain structure, and reading skills.J Clin Exp Neuropsychol. 2021 Apr;43(3):276-289. doi: 10.1080/13803395.2021.1912300. Epub 2021 May 7. J Clin Exp Neuropsychol. 2021. PMID: 33960276 Free PMC article.
-
Neuroimaging genetic analyses of novel candidate genes associated with reading and language.Brain Lang. 2017 Sep;172:9-15. doi: 10.1016/j.bandl.2016.07.002. Epub 2016 Jul 27. Brain Lang. 2017. PMID: 27476042
-
White matter but not grey matter predicts change in reading skills after intervention.Dyslexia. 2021 May;27(2):224-244. doi: 10.1002/dys.1668. Epub 2020 Sep 22. Dyslexia. 2021. PMID: 32959479
-
A systematic review and meta-analysis of imaging genetics studies of specific reading disorder.Cogn Neuropsychol. 2021 May;38(3):179-204. doi: 10.1080/02643294.2021.1969900. Epub 2021 Sep 16. Cogn Neuropsychol. 2021. PMID: 34529546 Free PMC article.
-
Decreased left middle temporal gyrus volume in antipsychotic drug-naive, first-episode schizophrenia patients and their healthy unaffected siblings.Schizophr Res. 2013 Mar;144(1-3):37-42. doi: 10.1016/j.schres.2012.12.018. Epub 2013 Jan 27. Schizophr Res. 2013. PMID: 23360727 Review.
References
Grants and funding
LinkOut - more resources
Full Text Sources
