. 2022 Dec 23;9(1):24.
doi: 10.3390/jof9010024.

Reprogramming of Fundamental miRNA and Gene Expression during the Barley- Piriformospora indica Interaction

Affiliations

Reprogramming of Fundamental miRNA and Gene Expression during the Barley- Piriformospora indica Interaction

Liang Li et al. J Fungi (Basel). .

Abstract

The interactions between plants and microorganisms, which are widely present in the microbial-dominated rhizosphere, have been studied. This association is highly beneficial to the organisms involved, as plants benefit soil microorganisms by providing them with metabolites, while microorganisms promote plant growth and development by promoting nutrient uptake and/or protecting the plant from biotic and abiotic stresses. Piriformospora indica, an endophytic fungus of Sebacinales, colonizes the roots of a wide range of host plants and establishes various benefits for the plants. In this work, an interaction between barley and the P. indica was established to elucidate microRNA (miRNA)-based regulatory changes in miRNA profiles and gene expression that occurred during the symbiosis. Growth promotion and vigorous root development were confirmed in barley colonized by P. indica. The genome-wide expression profile analysis of miRNAs in barley root showed that 7,798,928, 6,418,039 and 7,136,192 clean reads were obtained from the libraries of mock, 3 dai and 7 dai roots, respectively. Sequencing of the barley genome yielded in 81 novel miRNA and 450 differently expressed genes (DEGs). Additionally, 11, 24, 6 differentially expressed microRNAs (DEMs) in barley were found in the three comparison groups, including 3 dai vs. mock, 7 dai vs. mock and 7 dai vs. 3 dai, respectively. The predicted target genes of these miRNAs are mainly involved in transcription, cell division, auxin signal perception and transduction, photosynthesis and hormone stimulus. Transcriptome analysis of P. indica identified 667 and 594 differentially expressed genes (DEG) at 3 dai and 7 dai. Annotation and GO (Gene Ontology) analysis indicated that the DEGs with the greatest changes were concentrated in oxidoreductase activity, ion transmembrane transporter activity. It implies that reprogramming of fundamental miRNA and gene expression occurs both in barley and P. indica. Analysis of global changes in miRNA profiles of barley colonized with P. indica revealed that several putative endogenous barley miRNAs expressed upon colonization belonging to known micro RNA families involved in growth and developmental regulation.

Keywords: Piriformospora indica; RNA-seq; barley; miRNA; reprogramming; transcription factor.


Conflict of interest statement

The authors declare no conflict of interest.

Figures
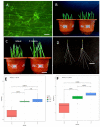
Figure 1
Figure 1
Root colonization by P. indica increases the growth and yield of barley. (A) Colonization pattern of P. indica on barley roots. Fluorescence microscopy showing WGA-AF488 staining of P. indica cell walls (λexc494 nm, λem515). (B,C) Total grain biomass of control vs. colonized plants at 3 dai and 7 dai. (D) Root branching between control and colonized roots at 3 dai. For b and c, barely seeds were seed soaking with 5 × 10⁵ chlamydospores per ml and grown in soil. (E) Shoot length of 3 dai vs. mock and 7 dai vs. mock. (F) weight of the seedlings from 3 dai vs. mock and 7 dai vs. mock Sample size n = 10. The results are from three independent biological replicates. The significance threshold for p values, corrected for multiple testing (Benjamini–Hochberg) was set at 0.05.
Figure 2
Figure 2
Volcano plots of colonization-associated, differentially expressed miRNA in barley. (A) Barley differentially expressed miRNA identified by comparing reads from colonized roots at 3 dai vs. mock. (B) Barley differentially expressed miRNA identified by comparing reads from colonized roots at 7 dai vs. mock. (C) Barley differentially expressed miRNA identified by comparing reads from colonized roots at 7 dai vs. 3 dai. The dashed line in the figure shows the set threshold, vertical line (x = ±1) and horizontal line (y = 2). Genes with padj values less than 0.05 and absolute values of foldchange greater than 2 are generally considered as differential genes.
Figure 3
Figure 3
Volcano plots of colonization-associated, differentially expressed genes (DEGs) in P. indica. (A) DEGs in P. indica identified by comparing reads from colonized roots at 3 dai vs. axenic mycelium. (B) DEGs in P. indica identified by comparing reads from colonized roots at 7 dai vs. axenic mycelium. (C) P. indica DEGs identified by comparing reads from colonized roots at 7 dai vs. 3 dai. The dashed line in the figure shows the set threshold, vertical line (x = ±1) and horizontal line (y = 2). Genes with padj values less than 0.05 and absolute values of foldchange greater than 2 are generally considered as differential genes.
Figure 4
Figure 4
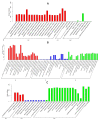
Go enrichment histogram of differentially expressed genes (DEGs) in P. indica. (A) GO enrichment in 3 days vs. control; (B) GO enrichment in 7 days vs. control. The abscissa denotes the name of GO entry, which is divided into three categories by box: BP: biological process, CC: cell component, MF: molecular function, distinguished by different frames, and the ordinate is the number of genes enriched by GO entry. The significance threshold for p values, corrected for multiple testing (Benjamini–Hochberg) was set at 0.05 (* ≤ 0.05).
Figure 5
Figure 5
Venn diagrams showing the sample-exclusive or communal presence of unique putative endogenous miRNAs. (A) putative endogenous miRNAs in 7 dai-mock vs. 3 dai-mock, (B) miRNAs in 3 dai-mock vs. 7dai-3dai; (C) miRNAs in 7 dai-mock vs. 7 dai-3 dai; (D) miRNAs in 3 dai-mock vs. 7 dai-3 dai vs. 7 dai-mock.
Figure 6
Figure 6
Go enrichment histogram of differentially expressed genes (DEGs) in barley. (A) GO enrichment in 3 dai vs. mock; (B) GO enrichment in 7 dai vs. mock. (C) GO enrichment in 7 dai vs. 3 dai. The abscissa denotes the name of GO entry, which is divided into three categories by box: BP: biological process, CC: cell component, MF: molecular function, distinguished by different frames, and the ordinate is the number of genes enriched by GO entry. (D) The chart shows that miRNA_novel 40 was downregulated and its target genes HORVU5Hr1G054420.4 was upregulated; another target gene HORVU7Hr1G088630 was downregulated. The experiments of q-PCR and the data analyses were performed in three biological replicates. ** Highly significant difference (p < 0.01).
Figure 7
Figure 7
The relative expression of miRNAs and their target genes involved in the growth-regulating factor, promoter-binding-like protein, and transcription factor. (A) The chart shows that miRNA_novel 1 was downregulated and its target genes HORVU7Hr1G012380 and HORVU5Hr1G055920 were down-regulated. (B) The chart shows that miRNA_444b was downregulated and its target genes HORVU3Hr1G076030 was upregulated but HORVU5Hr1G006020.8 were down-regulated. (C) The chart shows that miRNA_novel 22 was upregulated and its target genes HORVU4Hr1G082910 was upregulated, too. The other target gene HORVU2Hr1G085210 was downregulated.
Figure 8
Figure 8
Networks of miRNA–mRNA. (A) Network of miRNA–mRNA for 3 dai vs. mock. miRNA–mRNA network was constructed for 3 dai vs. mock based on the co-expression correlation of miRNA–mRNA (Circle node: miRNA. Diamond nodes: mRNA. Red color: up-regulation; green color: down-regulation). (B) Network of miRNA-mRNA for 7 dai vs. mock. miRNA–mRNA network was constructed for 7 dai vs. mock based on the co-expression correlation of miRNA-mRNA (Circle node: miRNA. Diamond nodes: mRNA. Red color: up-regulation; green color: down-regulation).
Figure 8
Figure 8
Networks of miRNA–mRNA. (A) Network of miRNA–mRNA for 3 dai vs. mock. miRNA–mRNA network was constructed for 3 dai vs. mock based on the co-expression correlation of miRNA–mRNA (Circle node: miRNA. Diamond nodes: mRNA. Red color: up-regulation; green color: down-regulation). (B) Network of miRNA-mRNA for 7 dai vs. mock. miRNA–mRNA network was constructed for 7 dai vs. mock based on the co-expression correlation of miRNA-mRNA (Circle node: miRNA. Diamond nodes: mRNA. Red color: up-regulation; green color: down-regulation).

Similar articles

Cited by

References

    1. Fesel P.H., Zuccaro A. Dissecting endophytic lifestyle along the parasitism/ mutualism continuum in Arabidopsis. Curr. Opin. Microbiol. 2016;32:103–112. doi: 10.1016/j.mib.2016.05.008. - DOI - PubMed
    1. Lagunas B., Schäfer P., Gifford M.L. Housing helpful invaders: The evolutionary and molecular architecture underlying plant root-mutualist microbe interactions. J. Exp. Bot. 2015;66:2177–2186. doi: 10.1093/jxb/erv038. - DOI - PMC - PubMed
    1. Vishwakarma K., Kumar N., Shandilya C., Mohapatra S., Bhayana S., Varma A. Revisiting plant-microbe interactions and microbial consortia application for enhancing sustainable agriculture: A review. Front. Microbiol. 2020;11:3195. doi: 10.3389/fmicb.2020.560406. - DOI - PMC - PubMed
    1. Li L., Guo N., Feng Y., Duan M., Li C. Effect of Piriformospora indica-induced systemic resistance and basal immunity against Rhizoctonia cerealis and Fusarium graminearum in wheat. Front. Plant Sci. 2022;13:836940. doi: 10.3389/fpls.2022.836940. - DOI - PMC - PubMed
    1. Deshmukh S., Huckelhoven R., Schäfer P., Imani J., Sharma M., Weiss M., Waller F., Kogel K.-H. The root endophytic fungus Piriformospora indica requires host cell death for proliferation during mutualistic symbiosis with barley. Proc. Natl. Acad. Sci. USA. 2006;103:18450–18457. doi: 10.1073/pnas.0605697103. - DOI - PMC - PubMed

LinkOut - more resources