. 2023 Jan 6;9(1):84.
doi: 10.3390/jof9010084.

The Botrytis cinerea Gene Expression Browser

Affiliations

The Botrytis cinerea Gene Expression Browser

Gabriel Pérez-Lara et al. J Fungi (Basel). .

Abstract

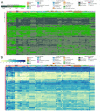
For comprehensive gene expression analyses of the phytopathogenic fungus Botrytis cinerea, which infects a number of plant taxa and is a cause of substantial agricultural losses worldwide, we developed BEB, a web-based B. cinerea gene Expression Browser. This computationally inexpensive web-based application and its associated database contain manually curated RNA-Seq data for B. cinerea. BEB enables expression analyses of genes of interest under different culture conditions by providing publication-ready heatmaps depicting transcript levels, without requiring advanced computational skills. BEB also provides details of each experiment and user-defined gene expression clustering and visualization options. If needed, tables of gene expression values can be downloaded for further exploration, including, for instance, the determination of differentially expressed genes. The BEB implementation is based on open-source computational technologies that can be deployed for other organisms. In this case, the new implementation will be limited only by the number of transcriptomic experiments that are incorporated into the platform. To demonstrate the usability and value of BEB, we analyzed gene expression patterns across different conditions, with a focus on secondary metabolite gene clusters, chromosome-wide gene expression, previously described virulence factors, and reference genes, providing the first comprehensive expression overview of these groups of genes in this relevant fungal phytopathogen. We expect this tool to be broadly useful in B. cinerea research, providing a basis for comparative transcriptomics and candidate gene identification for functional assays.

Keywords: BEB; Botrytis Expression Browser; Botrytis cinerea; RNA-Seq; phytopathogen; transcriptomics.


Conflict of interest statement

The authors declare no conflict of interest. The funders had no role in the design of the study; in the collection, analyses, or interpretation of data; in the writing of the manuscript; or in the decision to publish the results.

Figures
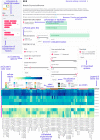
Figure 1
Figure 1
B. cinerea gene Expression Browser (BEB) graphical user interface. The BEB landing page contains a left sidebar section where experimental factors can be selected (1). The “Analyze” and “Read Me” modes (2) are available on the left sidebar (top section). Detailed instructions on how to use BEB are available in the latter display tool. In the upper section, users can choose to display average expression values or values for each replicate individually (3). Users can copy, paste, and submit gene IDs in the middle right section after selecting the “Paste a List” option (4). After clicking the “Submit” button (5), a heatmap depicting gene expression levels is generated at the bottom of the webpage. Clustering (6) and download options (7) are available in the middle section. BEB clusters are denoted with a color code shown at the outmost left column of the heatmap (8). A detailed description of each experiment is provided at the bottom of the figure, including SRA IDs (9).
Figure 2
Figure 2
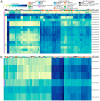
Expression patterns of gene clusters involved in the production of the phytotoxins botcinic acid (A) and botrydial (B) in B. cinerea. The heatmaps depict mRNA levels as calculated using DESeq2 (see Materials and Methods). The color scale represents the gene expression level from low to high (yellow to dark blue, respectively). The color code at the top of each heatmap indicates the culture media, plant material, and B. cinerea strain (key is shown above). Experimental conditions are indicated in each column, while genes are shown in each row. To streamline the overall figure, the description of each experiment was omitted from both heatmaps.
Figure 3
Figure 3
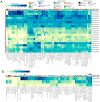
Expression patterns of five sesquiterpene cyclase enzyme-encoding genes. (A) Heatmap depicting the mRNA expression levels employing the BEB quartile-categorized expression option (lower: dark green; higher: light green). A continuous color scale (B) from low to high expression (yellow to dark blue, respectively) is also shown for comparative purposes. A color code at the top of each heatmap denotes culture conditions and B. cinerea strains. Experimental conditions and analyzed genes are indicated in columns and rows, respectively. Gene IDs are indicated at the right of each heatmap. A detailed description of each experiment is provided at the bottom of the figure, including SRA IDs for reference.
Figure 4
Figure 4
Polyketide synthetases (A, PKS) and diterpene cyclases (B) expression levels across experimental conditions. Both heatmaps indicate transcript levels with their corresponding expression scale from yellow to dark blue (low or high expression, respectively). The legend at the top of the figure denotes culture conditions and B. cinerea strains. Experimental conditions and genes are depicted in columns and rows, respectively. Gene IDs are provided at the right of each heatmap. A detailed description of each experiment is provided at the bottom of each heatmap (SRA IDs were not included). Columns denoted with arrows (in B) are discussed in the main text.
Figure 5
Figure 5
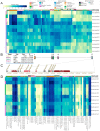
Expression patterns of genes encoding non-ribosomal peptide synthetases (NRPS) and hybrid polyketide synthetases (PKS-NRPS) in B. cinerea. (A) Expression patterns of all predicted NRPS and PKS-NRPS mentioned in Supplementary Material 3. To streamline the figure, the description of each experiment was omitted. (B) Identification of the five SM gene clusters on B. cinerea chromosome (Chr) 1. The table inset describes each of the five SM regions within Chr1, the predicted SM type, and their respective genomic coordinates. Colored boxes represent each region (right, with numbers). (C) Clustered genes within “Region 5” as described in (B). Boxes with arrowheads indicate each gene’s transcriptional orientation within the SM gene cluster. Dark red and pink arrowhead boxes indicate core and additional biosynthetic genes, respectively. Grey indicates other genes. Gene IDs and gene names are indicated. For simplicity, the “Bcin” prefix was omitted. (D) Expression patterns of all genes encoded in “Region 5” as indicated in (B,C), from bcnrps7 to bcpks5. Both heatmaps indicate mRNA levels and experimental conditions as described in the former figures. In (D), a detailed description of each experiment is provided at the bottom of the heatmap (SRA IDs were not included).
Figure 6
Figure 6
Expression levels of transcripts on mini chromosomes 17 (A) and 18 (B) of B. cinerea. Both heatmaps indicate mRNA levels specified by a scale from yellow to dark blue (low or high expression, respectively). Both heatmaps indicate mRNA levels and experimental conditions, as described in former figures.
Figure 7
Figure 7
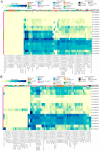
mRNA levels of virulence factors detected in proteomics studies. (A) A heatmap depicting the transcript levels of 176 protein-encoding genes whose products were detected in proteomics studies, as determined using the BEB quartile-categorized expression option (lower: dark green; higher: light green) or the continuous color scale (B) from low to high expression (yellow to dark blue). Owing to the number of genes being analyzed, neither culture conditions nor gene IDs are included in the figure (see Supplementary Material 5). In (A), genes with high and stable patterns of expression across conditions are indicated with a blue square bracket, while two groups of genes displaying an in planta “induced” pattern of expression are indicated with green and orange square brackets.
Figure 8
Figure 8
Transcript levels of previously validated reference genes employed in RT-qPCR studies of B. cinerea. The heatmap depicts transcript levels obtained using BEB, with a continuous color scale from yellow to dark blue indicating low or high expression, respectively. A detailed description of each experiment is provided at the bottom of the heatmap. Experimental conditions and genes are depicted in columns and rows, respectively. Gene IDs are provided at the right of the heatmap.

References

    1. Stark R., Grzelak M., Hadfield J. RNA sequencing: The teenage years. Nat. Rev. Genet. 2019;20:631–656. doi: 10.1038/s41576-019-0150-2. - DOI - PubMed
    1. Kukurba K.R., Montgomery S.B. RNA Sequencing and Analysis. Cold Spring Harb. Protoc. 2015;2015:951–969. doi: 10.1101/pdb.top084970. - DOI - PMC - PubMed
    1. Sheng Q., Vickers K., Zhao S., Wang J., Samuels D.C., Koues O., Shyr Y., Guo Y. Multi-perspective quality control of Illumina RNA sequencing data analysis. Brief. Funct. Genom. 2017;16:194–204. doi: 10.1093/bfgp/elw035. - DOI - PMC - PubMed
    1. Bolger A.M., Lohse M., Usadel B. Trimmomatic: A flexible trimmer for Illumina sequence data. Bioinformatics. 2014;30:2114–2120. doi: 10.1093/bioinformatics/btu170. - DOI - PMC - PubMed
    1. Dobin A., Davis C.A., Schlesinger F., Drenkow J., Zaleski C., Jha S., Batut P., Chaisson M., Gingeras T.R. STAR: Ultrafast universal RNA-seq aligner. Bioinformatics. 2012;29:15–21. doi: 10.1093/bioinformatics/bts635. - DOI - PMC - PubMed

LinkOut - more resources