. 2023 Jan 13;9(1):111.
doi: 10.3390/jof9010111.

The Effect of Sub-Lethal Successive Applications of Photodynamic Therapy on Candida albicans Biofilm Depends on the Photosensitizer

Affiliations

The Effect of Sub-Lethal Successive Applications of Photodynamic Therapy on Candida albicans Biofilm Depends on the Photosensitizer

Luana Mendonça Dias et al. J Fungi (Basel). .

Abstract

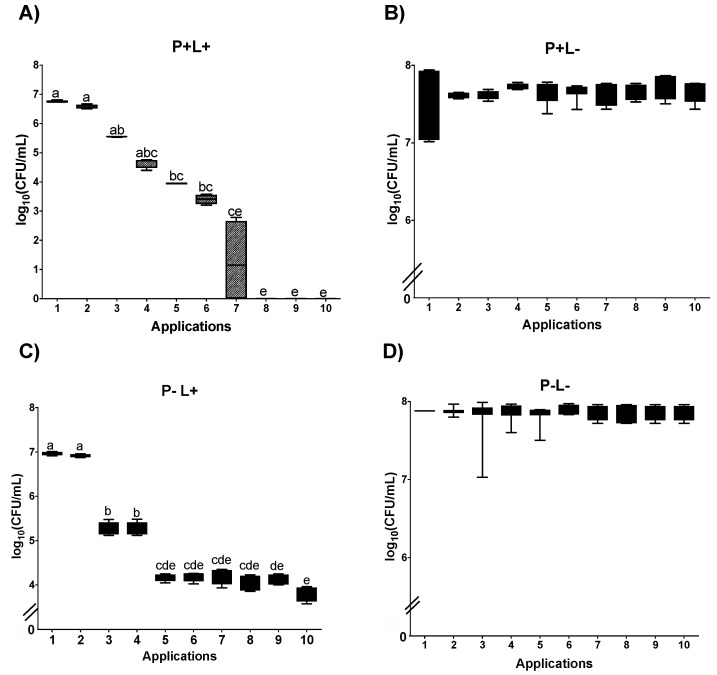
This study aimed to evaluate the potential of successive applications of sub-lethal doses of the antimicrobial photodynamic therapy (aPDT) mediated by Photodithazine® (PDZ) and curcumin (CUR) associated with LED in the viability, reactive oxygen species (ROS) production, and gene expression of Candida albicans. The microbial assays were performed using planktonic cultures and biofilms. Ten successive applications (Apl#) were performed: aPDT (P+L+; C+L+), photosensitizer (P+L-; C+L-), and LED (P-L+; C-L+). Control groups were used (P-L-; C-L-). The viability of C. albicans was determined by cultivating treated cultures on agar plates with or without fluconazole (FLU). In addition, the ROS detection and expression of SOD1, CAP1, and ERG11 genes were determined. For planktonic cultures, no viable colonies were observed after Apl#3 (without FLU) and Apl#2 (with FLU) for either photosensitizer. Biofilm treated with P+L+ resulted in the absence of cell viability after Apl#7, while C+L+ showed ~1.40 log10 increase in cell viability after Apl#2, regardless of FLU. For both photosensitizers, after the last application with viable colonies, the production of ROS was higher in the biofilms than in the planktonic cultures, and SOD1 expression was the highest in P+L+. A reduction of CAP1 and ERG11 expression occurred after P+L+, regardless of FLU. C+L+ had a higher level of ROS, and the treatments were non-significant for gene expression. Sub-lethal doses of aPDT mediated by CUR could induce C. albicans resistance in biofilms, while C. albicans cells in biofilms were susceptible to aPDT mediated by PDZ.

Keywords: Candida albicans; fluconazole; photodynamic therapy.


Conflict of interest statement

The authors declare no conflict of interest.

Figures

Figure 1
Figure 1
Flowchart of methodology based on successive applications of aPDT used in the present study.
Figure 2
Figure 2
Log10 values (CFU/mL) of planktonic cultures of C. albicans submitted to (A) aPDT (P+L+), (B) PDZ (P+L−), (C) light (P−L+), and (D) control group (P−L−). Upper limit of the box: third quartile; lower limit of the box: first quartile; error bars: minimum and maximum values. Different letters (a; b; c; d) denote statistical differences between columns (applications) according to Dunn’s post-test (p < 0.05) (n = 12).
Figure 3
Figure 3
Log10 values (CFU/mL) of planktonic cultures of C. albicans submitted to aPDT (A) (P+L+), (B) PDZ (P+L−), (C) light (P−L+), and (D) experiment control (P−L−) grown in fluconazole. Upper limit of the box: third quartile; lower limit of the box: first quartile; error bars: minimum and maximum values. Different letters (a; b; c; d; e) denote statistical differences between columns (applications) according to Dunn’s post-test (p < 0.05) (n = 12).
Figure 4
Figure 4
Log10 values (CFU/mL) of planktonic cultures of C. albicans submitted to (A) CUR (C+L+), (B) CUR (C+L−), (C) light (C−L+), and (D) experiment control (C−L−). Upper limit of the box: third quartile; lower limit of the box: first quartile; error bars: minimum and maximum values. Different letters (a; b; c; d) denote a statistical difference between columns (applications) according to Dunn’s post-test (p < 0.05) (n = 12).
Figure 5
Figure 5
Log10 values (CFU/mL) of planktonic cultures of C. albicans submitted to (A) CUR (C+L+), (B) CUR (C+L−), (C) light (C−L+), and (D) experiment control (C−L−) grown in fluconazole. Upper limit of the box: third quartile; lower limit of the box: first quartile; error bars: minimum and maximum values. Different letters (a; b; c; d) denote a statistical difference between columns (applications) according to Dunn’s post-test (p < 0.05) (n = 12).
Figure 6
Figure 6
Log10 values (CFU/mL) of C. albicans biofilms submitted to (A) aPDT (P+L+), (B) PDZ (P+L−), (C) light (P−L+), and experiment control (D) (P−L−). Upper limit of the box: third quartile; lower limit of the box: first quartile; error bars: minimum and maximum values. Different letters (a; b; c; d; e; f) denote a statistical difference between columns (applications) according to Dunn’s post-test (p < 0.05) (n = 12).
Figure 7
Figure 7
Log10 values (CFU/mL) of C. albicans biofilms submitted to (A) aPDT (P+L+), (B) PDZ (P+L−), (C) light (P−L+), and (D) experiment control (P−L−) grown in fluconazole. Upper limit of the box: third quartile; lower limit of the box: first quartile; error bars: minimum and maximum values. Different letters (a; b; c; d; e) denote statistical differences between columns (applications) according to Dunn’s post-test (p < 0.05) (n = 12).
Figure 8
Figure 8
Log10 values (CFU/mL) of C. albicans biofilms submitted to (A) aPDT (C+L+), (B) CUR (C+L−), (C) light (C−L+), and (D) experiment control (C−L−). Upper limit of the box: third quartile; lower limit of the box: first quartile; error bars: minimum and maximum values. Different letters (a; b; c; d) denote statistical differences between columns (applications) according to Dunn’s post-test (p < 0.05) (n = 12).
Figure 9
Figure 9
Log10 values (CFU/mL) of C. albicans biofilms submitted to (A) aPDT (C+L+), (B) CUR (C+L−), (C) light (C−L+), and (D) experiment control (C−L−) grown in fluconazole. Upper limit of the box: third quartile; lower limit of the box: first quartile; error bars: minimum and maximum values. Different letters (a; b; c; d; e) denote statistical differences between columns (applications) according to Dunn’s post-test (p < 0.05) (n = 12).
Figure 10
Figure 10
Graphic representation of the mean values and standard deviation of ROS production, measured as fluorescence intensity by fluorometric H2DCF-DA oxidation, of C. albicans suspensions (A,B) and biofilm (C,D) after the first application (A,C) and seventh application (B,D), subjected to aPDT (P+L+), PDZ (P+L−), light only (P−L+), no treatment (P−L−), hydrogen peroxide (H2O2), and negative control group with cells treated in no fluorochrome (NC). A.U.—arbitrary units. Different letters (a; b; c; d; e) denote statistical differences between columns (groups) according to the Games–Howell post-test (p < 0.05) (n = 12).
Figure 11
Figure 11
Graphic representation of the mean values and standard deviation of ROS production, measured as fluorescence intensity by fluorometric H2DCF-DA oxidation, of C. albicans suspensions (A,B) and biofilm (C,D) after the first application (A,C), third application (B), and tenth application (D) subjected to aPDT (C+L+), CUR (C+L−), light only (C−L+), no treatment (C−L−), hydrogen peroxide (H2O2), and negative control group with cells treated in no fluorochrome (NC). A.U.—arbitrary units. Different letters (a; b; c; d) denote statistical differences between columns (groups) according to the Games–Howell post-test (p < 0.05) (n = 12).
Figure 12
Figure 12
Graphic representation of mean ± confidence interval of 95% of SOD1 (A,B), CAP1 (C,D), and ERG11 (E,F) gene expression in each experimental group of C. albicans cells removed from biofilm cultured in SDA without (A,C,E) and with (B,D,F) fluconazole after first (Apl#1), fourth (Apl#4) and seventh (Apl#7) application of PDZ-mediated aPDT (P+L+), PS control (P+L−), light control (P−L+), and experiment control group (P−L−). Minimum and maximum values of the copies/µL error bar represent the lower and upper limits of the confidence interval, respectively. The non-intersection of error bars denotes statistical difference (p < 0.05).
Figure 13
Figure 13
Graphic representation of mean ± confidence interval of 95% of SOD1 (A,B), CAP1 (C,D), and ERG11 (E,F) gene expression in each experimental group of C. albicans cells removed from biofilm cultured in SDA without (A,C,E) and with (B,D,F) fluconazole after first (Apl#1), third (Apl#3), sixth (Apl#6) and tenth (Apl #10) application of CUR-mediated aPDT (C+L+), FS control (C+L−), light control (C−L+), and experiment control group (C−L−). Minimum and maximum values of the copies/µL error bar represent the lower and upper limits of the confidence interval, respectively. The non-intersection of error bars denotes statistical difference (p < 0.05).

References

    1. Mukaremera L., Lee K.K., Mora-Montes H.M., Gow N.A.R. Candida albicans yeast, pseudohyphal, and hyphal morphogenesis differentially affects immune recognition. Front. Immunol. 2017;8:1. doi: 10.3389/fimmu.2017.00629. - DOI - PMC - PubMed
    1. Gow N.A.R., Yadav B. Microbe Profile: Candida albicans: A shape-changing, opportunistic pathogenic fungus of humans. Microbiology. 2017;163:1145–1147. doi: 10.1099/mic.0.000499. - DOI - PubMed
    1. Figueiredo-Godoi L.M.A., Garcia M.T., Pinto J.G., Ferreira-Strixino J., Faustino E.G., Pedroso L.L.C., Junqueira J.C. Antimicrobial Photodynamic Therapy Mediated by Fotenticine and Methylene Blue on Planktonic Growth, Biofilms, and Burn Infections of Acinetobacter baumannii. Antibiotics. 2022;11:619. doi: 10.3390/antibiotics11050619. - DOI - PMC - PubMed
    1. Dovigo L.N., Pavarina A.C., Carmello J.C., Machado A.L., Brunetti I.L., Bagnato V.S. Susceptibility of clinical isolates of Candida to photodynamic effects of curcumin. Lasers Surg. Med. 2011;43:927–934. doi: 10.1002/lsm.21110. - DOI - PubMed
    1. Dovigo L.N., Pavarina A.C., Ribeiro A.P., Brunetti I.L., Costa C.A., Jacomassi D.P., Bagnato V.S., Kurachi C. Investigation of the photodynamic effects of curcumin against Candida albicans. Photochem. Photobiol. 2011;87:895–903. doi: 10.1111/j.1751-1097.2011.00937.x. - DOI - PubMed