Review
. 2023 Jan 8;16(2):605.
doi: 10.3390/ma16020605.

Anomalies of Brillouin Light Scattering in Selected Perovskite Relaxor Ferroelectric Crystals

Affiliations
Review

Anomalies of Brillouin Light Scattering in Selected Perovskite Relaxor Ferroelectric Crystals

Venkatasubramanian Sivasubramanian et al. Materials (Basel). .

Abstract

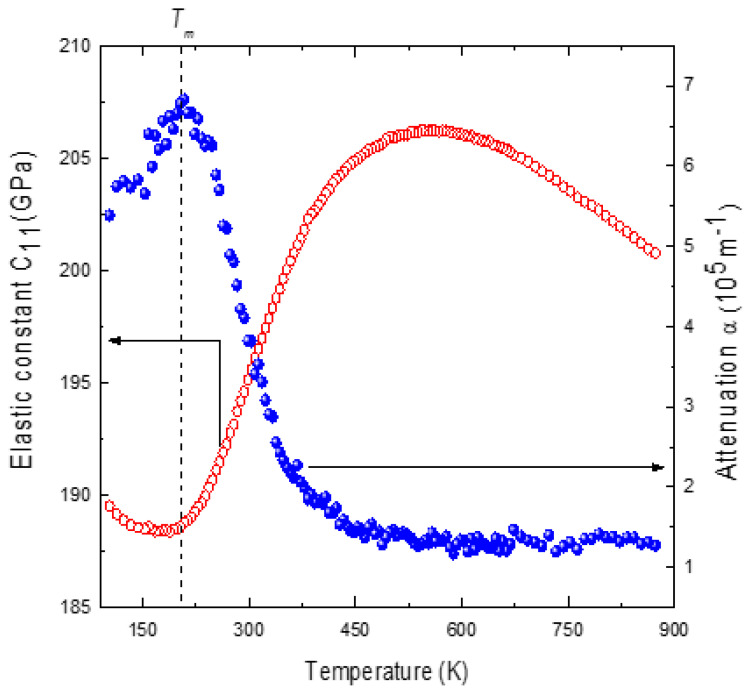
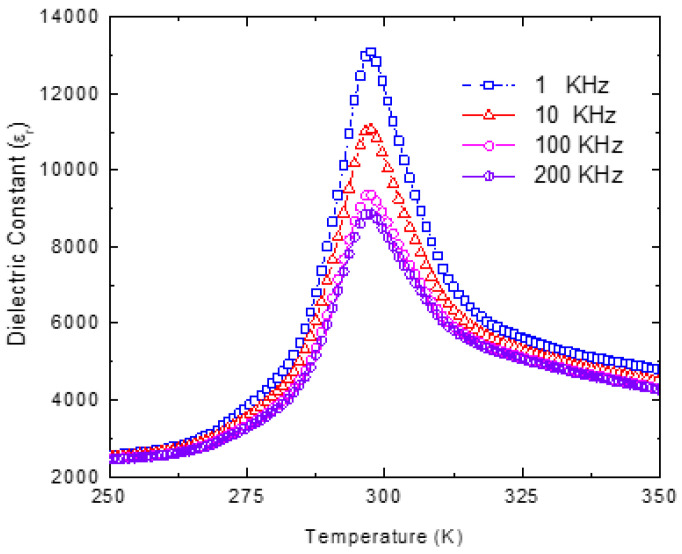
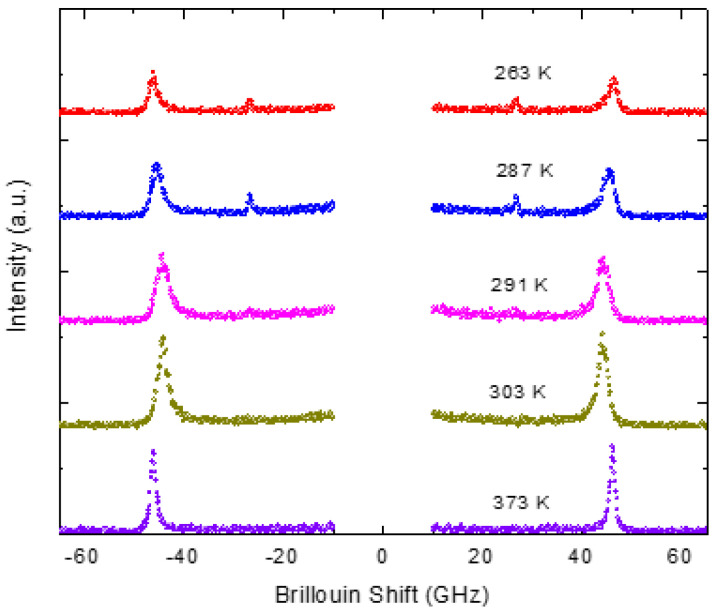
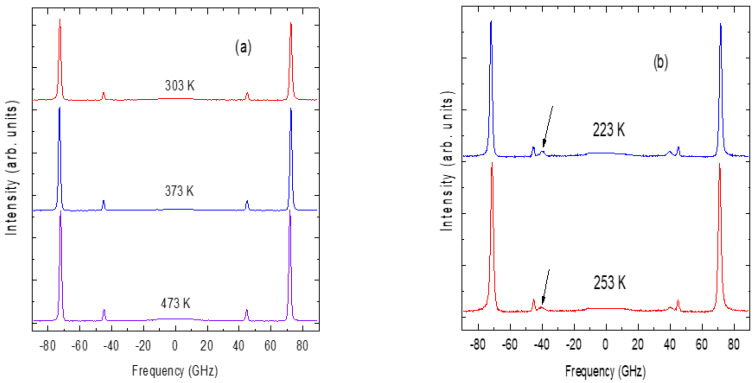
Compositionally disordered perovskite compounds have been one of the exotic topics of research during the past several years. Colossal piezoelectric and electrostrictive effects have been observed in disordered perovskite ferroelectric materials. The key ingredient in the physical behavior of disordered perovskites is the nucleation and growth of the local dipolar regions called polar nanoregions (PNRs). PNRs begin to nucleate far above the temperature of the dielectric maximum Tm and exhibit varied relaxation behavior with temperature. The evidence for the existence of various stages in the relaxation dynamics of PNRs was revealed through the study of the temperature evolution of optical phonons by Raman scattering. The quasi-static regime of PNRs is characterized by the strong coupling between the local polarization and strain with the local structural phase transition and the critical slowing of the relaxation time. Strong anomalies in the frequency and the width of the acoustic phonons, and emergence of the central peak in the quasi-static region of the relaxation dynamics of PNRs have been observed through Brillouin scattering studies. In this review, we discuss the anomalies observed in Brillouin scattering in selected disordered perovskite ferroelectrics crystals such as Pb(Mg1/3Ta2/3)O3, Pb(Sc1/2Ta1/2)O3, 0.65PIN-0.35PT and Sr0.97Ca0.03TiO3 to understand dynamical behavior of PNRs.

Keywords: Brillouin scattering; acoustic phonon; disordered ferroelectrics; perovskites; polar nanoregions; relaxation.


Conflict of interest statement

The authors declare no conflict of interest.

Figures

Figure 1
Figure 1
Brillouin spectra of PMT at different temperatures(Reprinted with kind permission from Ref. [41]. 2015, the European Physical Journal (EPJ)).
Figure 2
Figure 2
Temperature dependence of the elastic constant C11 (open circles) and attenuation α (closed circles) of PMT (Reprinted with kind permission from Ref. [41]. 2015, the European Physical Journal (EPJ)).
Figure 3
Figure 3
Fit of the experimental C11 (open circles) with Equation (6) (solid line) of PMT (Reprinted with kind permission from Ref. [41]. 2015, the European Physical Journal (EPJ)).
Figure 4
Figure 4
(ad)Typical broadband Brillouin spectra of PMT at (a) 293 K, (b) 273 K, (c) 253 K and (d) 223 K.The solid black line is the Lorentzian fit of the experimental data.
Figure 5
Figure 5
Temperature variation inthe width of the central peak of PMT (Reprinted with kind permission from Ref. [41]. 2015, the European Physical Journal (EPJ)).
Figure 6
Figure 6
Fit of the Arrhenius law (solid line) with the relaxation time τ (solid sphere) (Reprinted with kind permission from Ref. [41]. 2015, the European Physical Journal (EPJ)).
Figure 7
Figure 7
Powder X-ray diffraction of PST.
Figure 8
Figure 8
Low frequency dielectric dispersion of PST.
Figure 9
Figure 9
Brillouin spectra of PST measured in the FSR range of 75 GHz.
Figure 10
Figure 10
Temperature variation in frequency (open circles) and the width(closed circles) of the LA phonon of PST.
Figure 11
Figure 11
Plot showing 1LA as a function temperature for the LA phonon of PST. Points are the experimental data and the solid line is the fit of Equation (16).
Figure 12
Figure 12
Brillouin spectra of 0.65PIN-0.35PT at various temperatures.
Figure 13
Figure 13
Temperature variation in the frequency and the width of the 0.65PIN-0.35PT LA phonon.
Figure 14
Figure 14
(ad)Broad central peak of 0.65PIN-0.35PT at (a) 633 K, (b) 593 K, (c) 573 K and (d) 463 K.
Figure 15
Figure 15
Temperature dependence of relaxation time of LA (solid squares), broad (solid circles) and narrow (solid triangles) central peaks of 0.65PIN-0.35PT.
Figure 16
Figure 16
Brillouin spectra of SCT-0.03 measured with FSR of 100 GHz at (a) 473, 373 and 303 K and (b) 253 and 223 K. (Figure 16a. Reprinted with kind permission from Ref. [83]. Copyright (2020) The Japan Society of Applied Physics).
Figure 17
Figure 17
Temperature variation inthe frequency and the width of the SCT-0.03LA phonon. (Reprinted with kind permission from Ref. [83]. Copyright (2020) The Japan Society of Applied Physics).
Figure 18
Figure 18
Plot showing 1LA as a function temperature for the LA phonon of SCT-0.03. The solid line shows the fit of the experimental data points.
Figure 19
Figure 19
Temperature variation in thefrequency and the width of TA1 phonon mode. (Reprinted with kind permission from Ref. [83]. Copyright (2020) The Japan Society of Applied Physics).
Figure 20
Figure 20
The frequency and the width of the TA2 phonon as a function of temperature.

References

    1. Lines M.E., Glass A.M. Principles and Applications of Ferroelectrics and Related Materials. Clarendon Press; Oxford, UK: 1977. pp. 24–58.
    1. Samara G.A. Ferroelectricity Revisited-Advances in Materials and Physics. Solid State Phys. 2001;56:252–343.
    1. Hochli U.T., Maglione M. Dielectric relaxation spectroscopy and the ground state of K1−xLixTaO3. J. Phys. Condens. Matter. 1989;1:2241–2256. doi: 10.1088/0953-8984/1/12/009. - DOI
    1. Toulouse J., Pattnaik R. Collective behaviours in disordered ferroelectrics KLT and KTN. J. Korean Phys. Soc. 1998;32:S942–S946.
    1. Samara G.A. Nature of the phase transition in KTaO3 with random site impurities. Jpn. J. Appl. Phys. 1985;24:80–84. doi: 10.7567/JJAPS.24S2.80. - DOI