. 2023 Jan 3;13(1):79.
doi: 10.3390/metabo13010079.

Lipidomic Predictors of Coronary No-Reflow

Affiliations

Lipidomic Predictors of Coronary No-Reflow

Arun Surendran et al. Metabolites. .

Abstract

The ‘no-reflow’ phenomenon (NRP) after primary percutaneous coronary intervention (PCI) is a serious complication among acute ST-segment elevation myocardial infarction (STEMI) patients. Herein, a comprehensive lipidomics approach was used to quantify over 300 distinct molecular species in circulating plasma from 126 patients with STEMI before and after primary PCI. Our analysis showed that three lipid classes: phosphatidylcholine (PC), alkylphosphatidylcholine (PC(O)), and sphingomyelin (SM), were significantly elevated (p < 0.05) in no-reflow patients before primary PCI. The levels of individual fatty acids and total fatty acid levels were significantly lower (p < 0.05) in no-reflow subjects after PCI. The grouping of patients based on ECG ST-segment resolution (STR) also demonstrated the same trend, confirming the possible role of these differential lipids in the setting of no-reflow. Sphingomyelin species, SM 41:1 and SM 41:2, was invariably positively correlated with corrected TIMI frame count (CTFC) at pre-PCI and post-PCI. The plasma levels of SM 42:1 exhibited an inverse association (p < 0.05) consistently with tumor necrosis factor-alpha (TNF-α) at pre-PCI and post-PCI. In conclusion, we identified plasma lipid profiles that distinguish individuals at risk of no-reflow and provided novel insights into how dyslipidemia may contribute to NRP after primary PCI.

Keywords: ether-lipids; lipidomics; no-reflow; sphingomyelin.


Conflict of interest statement

All authors declare no conflict relevant to the contents of this article.

Figures

Figure 1
Figure 1
Altered lipid species and classes during the coronary no-reflow phenomenon. (A) The significantly altered lipid species between normal and no-reflow subjects at pre-PCI. (B,C) Boxplots of the abundance of lipid classes significantly differed between normal and no-reflow subjects at pre-PCI. (D) The significantly altered lipid species between normal and no-reflow subjects at post-PCI. (E,F) Boxplots of the abundance of lipid classes significantly differed between normal and no-reflow subjects at post-PCI. Green circles show lipid species with p < 0.05, and purple circles show lipid species with Q (corrected p) < 0.2 after independent Student’s t-test. # and ## represent statistical significance at p < 0.05 and Q < 0.2 after independent Student’s t-test.
Figure 2
Figure 2
Lipids at pre- and post-PCI. The number of significantly altered lipid species (shown in a darker shade) at (A) pre-PCI and (B) post-PCI as parts of the corresponding whole lipid class. (C) Venn diagram shows the number of significantly altered lipid species (p < 0.05) unique or common between pre-PCI and post-PCI.
Figure 3
Figure 3
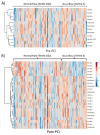
Clustered heatmap of significantly altered lipid species. A hierarchically clustered heat map representing significantly altered lipid species (p < 0.05) between normal and no-reflow subjects at (A) pre-PCI and (B) at post-PCI. Data were normalized, log-transformed, and auto scaled.
Figure 4
Figure 4
Correlation between lipid species and clinical parameters. The correlation plots depict the strength of the relationship (Pearson correlation) between significantly altered lipid species (p < 0.05) and clinical parameters at (A) pre-PCI and (B) post-PCI. Positive correlations are displayed in red and negative correlations in blue. *, **, *** represents the significant level at p < 0.05, 0.01, 0.001, respectively.
Figure 5
Figure 5
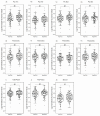
Time-dependent changes in lipid species. The box plots show the significantly altered lipid species (p < 0.05) in time (between pre-PCI and post-PCI). A paired t-test was run on the list of 26 lipids and 4 lipid classes (significantly different between normal and no-reflow patients) to determine whether there was a statistically significant difference in time. ## represents the significant level at Q (corrected p) < 0.05.
Figure 6
Figure 6
Altered lipid species and classes based on ST segment resolution (A) The significantly altered lipid species between normal and no-reflow subjects (ST resolution < 50%) at pre-PCI. (B,C) Boxplots of the abundance of lipid classes significantly differed between normal and no-reflow subjects (ST resolution < 50%) at pre-PCI. (D) The significantly altered lipid species between normal and no-reflow subjects (ST resolution < 50%) at post-PCI. (E,F) Boxplots of the abundance of lipid classes significantly differed between normal and no-reflow subjects (ST resolution < 50%) at post-PCI. Green circles show lipid species with p < 0.05, and grey circles show lipid species with p > 0.05 after independent Student’s t-test. # represent statistical significance at p < 0.05 after independent Student’s t-test.
Figure 7
Figure 7
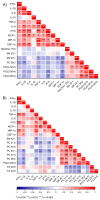
Correlation of cytokines with lipid species. The plot shows the association of significantly altered lipids based on both corrected TIMI frame count (CTFC) and ST-segment resolution with 10 cytokines at pre-PCI (A) and post-PCI (B) for 28 subjects. The red color symbolizes positive correlation, and the blue color symbolizes negative correlation. *, **, *** represents the significant level at p < 0.05, 0.01, 0.001, respectively.

References

    1. Gupta S., Gupta M.M. No reflow phenomenon in percutaneous coronary interventions in ST-segment elevation myocardial infarction. Indian Heart J. 2016;68:539–551. doi: 10.1016/j.ihj.2016.04.006. - DOI - PMC - PubMed
    1. Reffelmann T., Hale S.L., Li G., Kloner R.A. Relationship between no reflow and infarct size as influenced by the duration of ischemia and reperfusion. Am. J. Physiol. Heart Circ. Physiol. 2002;282:H766–H772. doi: 10.1152/ajpheart.00767.2001. - DOI - PubMed
    1. Rezkalla S.H., Kloner R.A. No-Reflow Phenomenon. Circulation. 2002;105:656–662. doi: 10.1161/hc0502.102867. - DOI - PubMed
    1. Elbendary M.A.W., Saleh M.A., Sabet S.S., Bastawy I. Correlation between endothelial dysfunction and occurrence of no-reflow in patients undergoing post-thrombolysis early invasive percutaneous intervention for ST-elevation myocardial infarction. Egypt Heart J. 2022;74:70. doi: 10.1186/s43044-022-00309-2. - DOI - PMC - PubMed
    1. Savic L., Mrdovic I., Asanin M., Stankovic S., Lasica R., Krljanac G., Rajic D., Simic D. The Impact of Kidney Function on the Slow-Flow/No-Reflow Phenomenon in Patients Treated with Primary Percutaneous Coronary Intervention: Registry Analysis. J. Interv. Cardiol. 2022;2022:5815274. doi: 10.1155/2022/5815274. - DOI - PMC - PubMed

LinkOut - more resources