

Effect of Parthenium hysterophorus L. Invasion on Soil Microbial Communities in the Yellow River Delta, China
- PMID: 36677310
- PMCID: PMC9863114
- DOI: 10.3390/microorganisms11010018
Effect of Parthenium hysterophorus L. Invasion on Soil Microbial Communities in the Yellow River Delta, China
Abstract
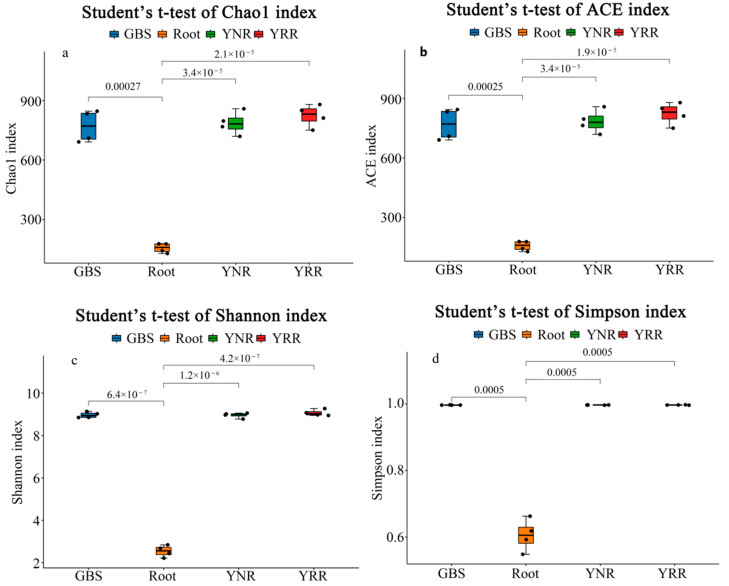
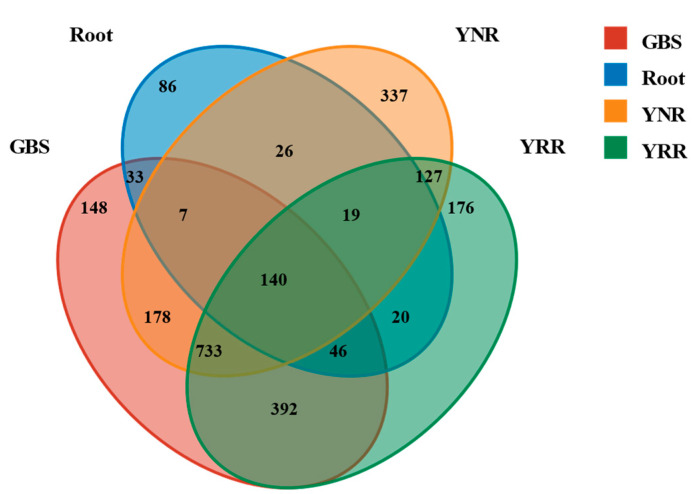
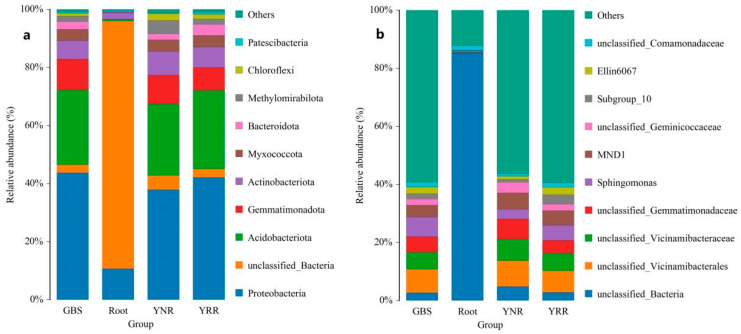
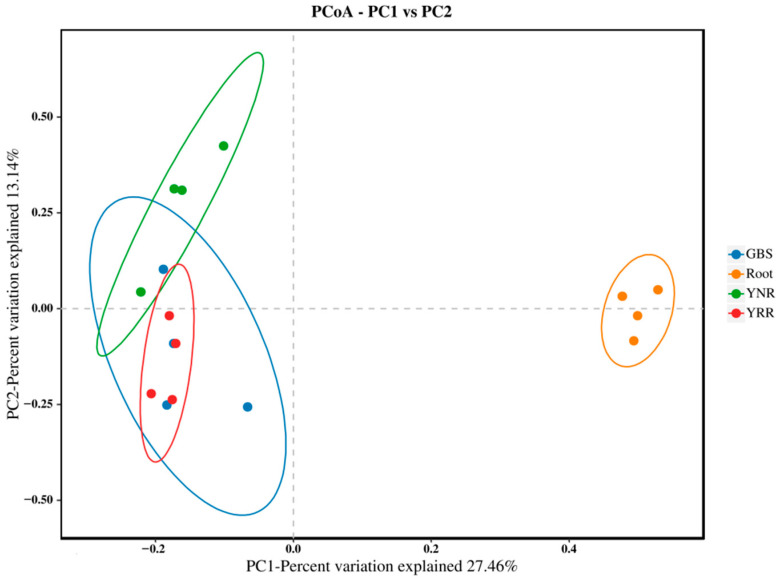
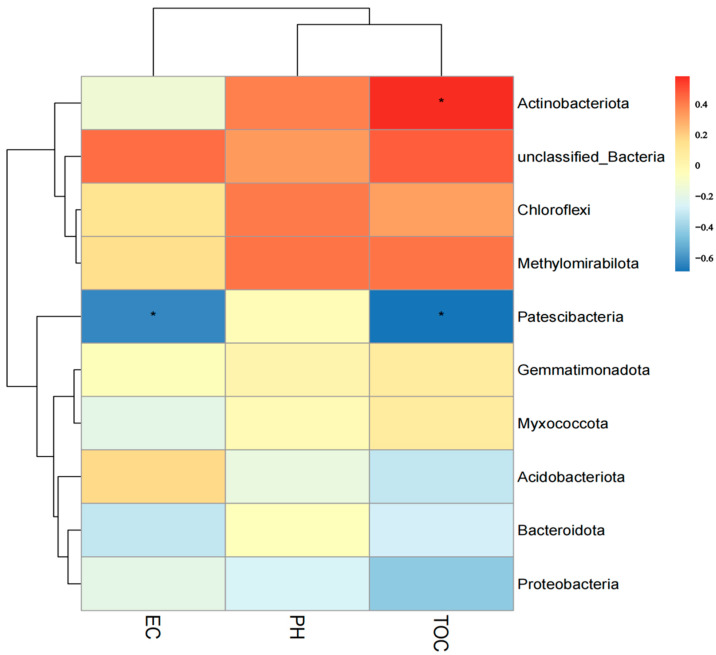
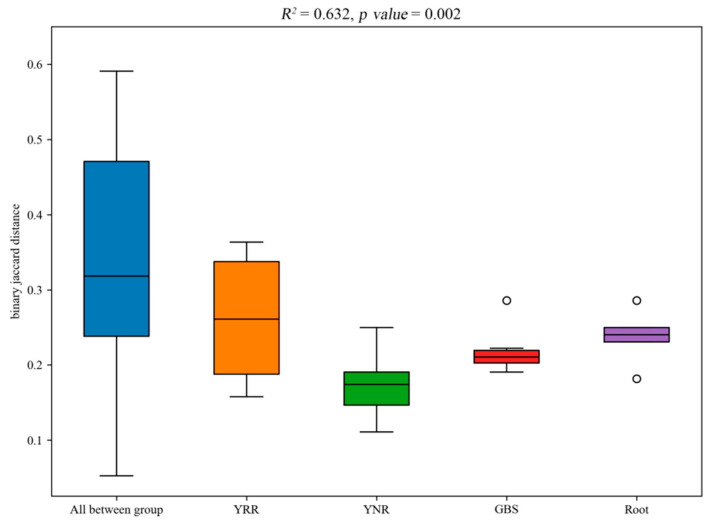
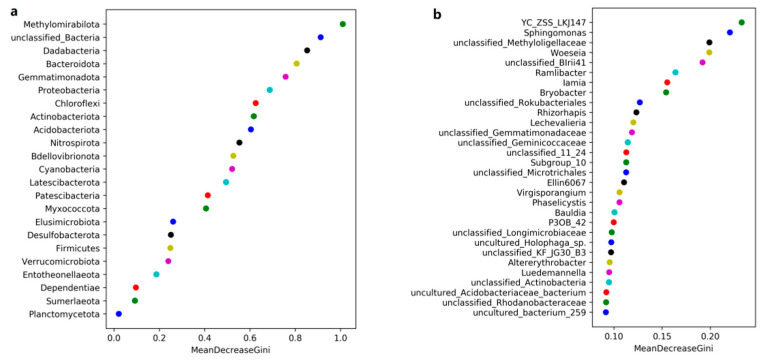
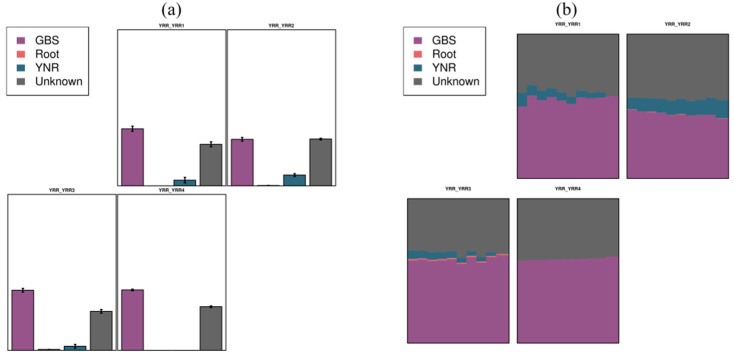
Parthenium hysterophorus L., as an invasive plant, has negatively impacted the ecosystem functioning and stability of the terrestrial ecosystem in China. However, little information was available for its effects on microorganisms in the Yellow River Delta (YRD), the biggest newly-formed wetland in China. In the present study, high-throughput sequencing technology was used to obtain the bacterial community in soils and roots of different plant species, including P. hysterophorus and some native ones in the YRD. Our results showed that the Proteobacteria, Acidobacteriota, Gemmatimonadota, and Actinobacteriota were dominant in the rhizosphere soils of P. hysterophorus (84.2%) and Setaria viridis (86.47%), and the bulk soils (80.7%). The Proteobacteria and Actinobacteriota were dominant within the root of P. hysterophorus. A total of 2468 bacterial OTUs were obtained from different groups among which 140 were observed in all the groups; 1019 OTUs were shared by P. hysterophorus non-rhizosphere soil bacteria (YNR) P. hysterophorus rhizosphere soil bacteria (YRR) groups. The indexes of the ACE (823.1), Chao1 (823.19), Simpson (0.9971), and Shannon (9.068) were the highest in the YRR groups, showing the greatest bacterial community diversity. Random forest analysis showed that the Methylomirabilota and Dadabacteria (at the phylum level) and the Sphingomonas, and Woeseia (at the genus level) were identified as the main predictors among different groups. The LEfSe results also showed the essential role of the Acidobacteriota in the YRR group. The SourceTracker analysis of the bacterial community of the YRR group was mainly from GBS groups (average 53.14%) and a small part was from YNR groups (average 6.56%), indicating that the P. hysterophorus invasion had a more significant effect on native plants' rhizosphere microorganisms than soil microorganisms. Our observations could provide valuable information for understanding the bacterial diversity and structure of the soil to the invasion of P. hysterophorus.
Keywords: Alpha diversity; LEfSe analysis; high-throughput sequencing; rhizosphere soil.
Conflict of interest statement
The authors declare no conflict of interest.
Figures

Similar articles
-
[Denitrification Rates and nirS-type Denitrifying Bacteria Community Structure Characteristics of Bulk and Rhizosphere Soil in Spring and Summer in the Alpine Wetlands of the Qinghai-Tibet Plateau].Huan Jing Ke Xue. 2021 Oct 8;42(10):4959-4967. doi: 10.13227/j.hjkx.202101258. Huan Jing Ke Xue. 2021. PMID: 34581140 Chinese.
-
The Effects of Secondary Growth of Spartina alterniflora after Treatment on Sediment Microorganisms in the Yellow River Delta.Microorganisms. 2022 Aug 26;10(9):1722. doi: 10.3390/microorganisms10091722. Microorganisms. 2022. PMID: 36144325 Free PMC article.
-
Soil bacterial diversity, structure, and function of Suaeda salsa in rhizosphere and non-rhizosphere soils in various habitats in the Yellow River Delta, China.Sci Total Environ. 2020 Oct 20;740:140144. doi: 10.1016/j.scitotenv.2020.140144. Epub 2020 Jun 12. Sci Total Environ. 2020. PMID: 32562999
-
Impact of Parthenium hysterophorus L. invasion on soil nitrogen dynamics of grassland vegetation of Indo-Gangetic plains, India.Environ Monit Assess. 2021 Apr 20;193(5):286. doi: 10.1007/s10661-021-09070-6. Environ Monit Assess. 2021. PMID: 33877445
-
Archaeal community succession with fine root growth in poplar plantation.Ying Yong Sheng Tai Xue Bao. 2019 Mar;30(3):849-856. doi: 10.13287/j.1001-9332.201903.034. Ying Yong Sheng Tai Xue Bao. 2019. PMID: 30912377 English.
Cited by
-
Reconstructing the biological invasion of noxious invasive weed Parthenium hysterophorus and invasion risk assessment in China.Front Plant Sci. 2024 Sep 19;15:1430576. doi: 10.3389/fpls.2024.1430576. eCollection 2024. Front Plant Sci. 2024. PMID: 39363921 Free PMC article.
-
Response of bacterial community structure in saline soils to the application of kitchen waste-derived fermented organic fertilizer.World J Microbiol Biotechnol. 2025 May 3;41(5):162. doi: 10.1007/s11274-025-04386-8. World J Microbiol Biotechnol. 2025. PMID: 40316880
-
Metagenomics-based study of rhizospheric microorganisms of Poa alpigena L. in Qinghai Lake, Ganzi River Plateau.Front Plant Sci. 2025 Feb 21;15:1518637. doi: 10.3389/fpls.2024.1518637. eCollection 2024. Front Plant Sci. 2025. PMID: 40060112 Free PMC article.
References
-
- Zhang H., Chen X.B., Luo Y.M. An overview of ecohydrology of the Yellow River delta wetland. Ecohydrol. Hydrobiol. 2016;16:39–44. doi: 10.1016/j.ecohyd.2015.10.001. - DOI
-
- Shang S., Hu S.X., Liu X.X., Zang Y., Chen J., Gao N., Li L.Y., Wang J., Liu L.X., Xu J.K., et al. Effects of Spartina alterniflora invasion on the community structure and diversity of wetland soil bacteria in the Yellow River Delta. Ecol. Evol. 2022;12:e8905. doi: 10.1002/ece3.8905. - DOI - PMC - PubMed
-
- Khan N., Bibi K., Ullah R. Distribution pattern and ecological determinants of an invasive plant Parthenium hysterophorus L., in Malakand division of Pakistan. J. Mt. Sci. 2020;17:1670–1683. doi: 10.1007/s11629-019-5932-7. - DOI
Grants and funding
LinkOut - more resources
Full Text Sources
Miscellaneous
