. 2023 Jan 11;11(1):180.
doi: 10.3390/microorganisms11010180.

Human Adenovirus and Influenza A Virus Exacerbate SARS-CoV-2 Infection in Animal Models

Affiliations

Human Adenovirus and Influenza A Virus Exacerbate SARS-CoV-2 Infection in Animal Models

Victor A Svyatchenko et al. Microorganisms. .

Abstract

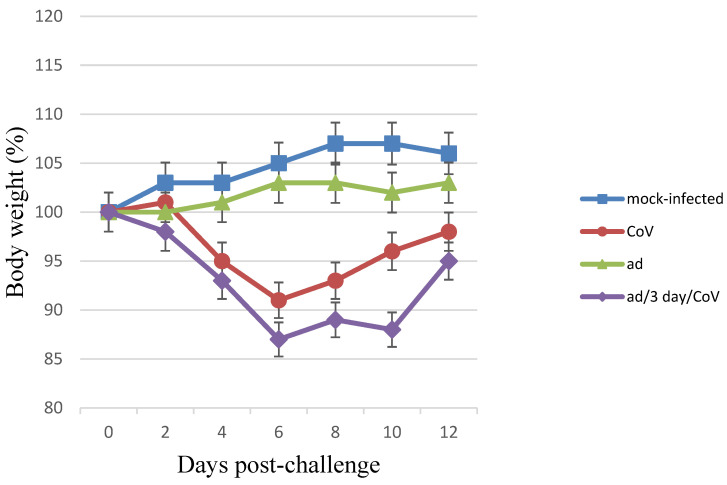
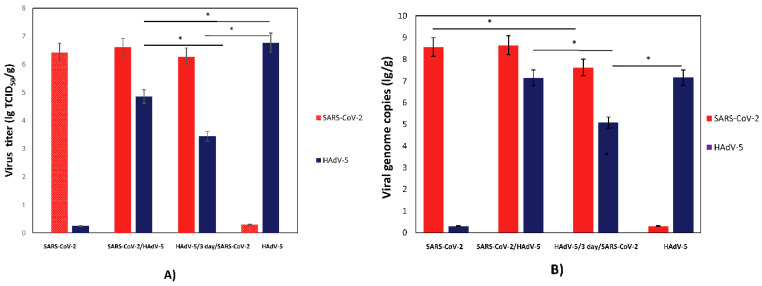
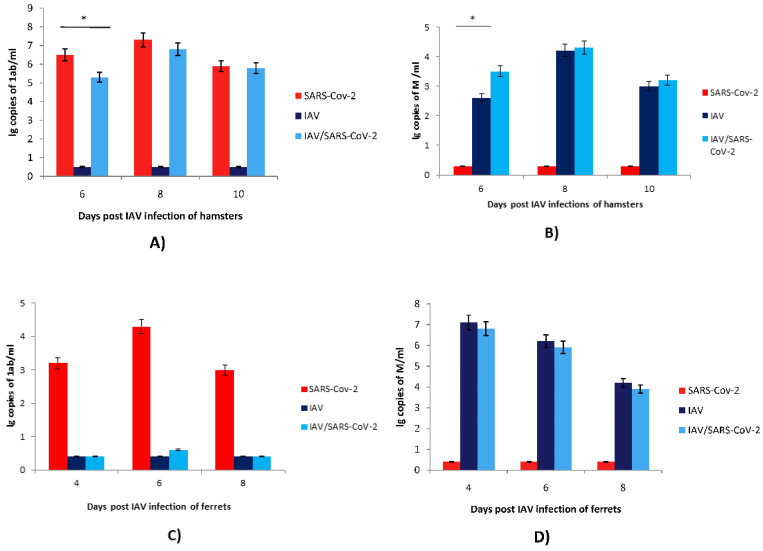
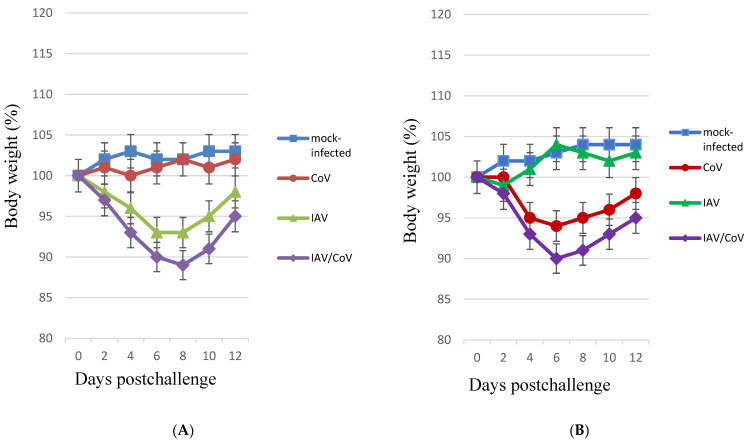
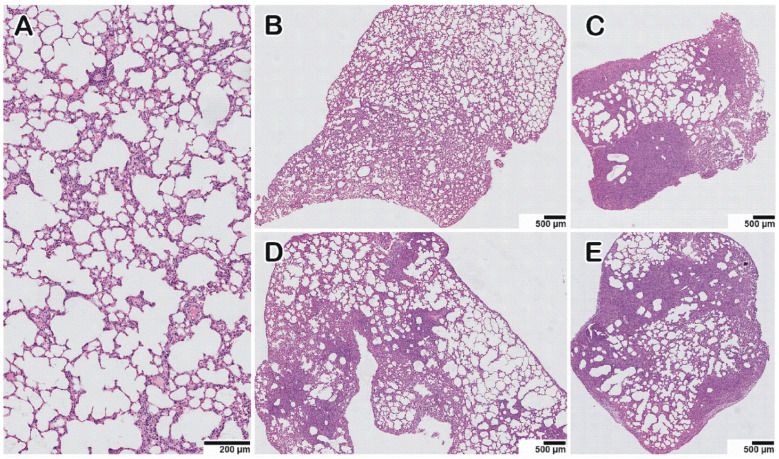
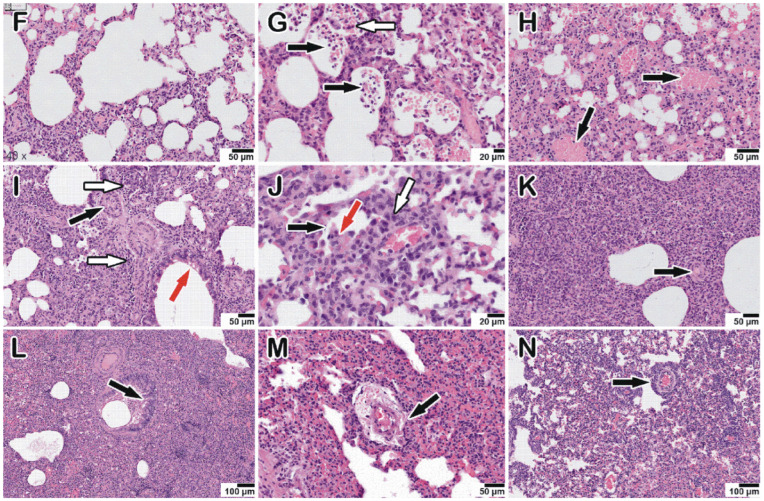
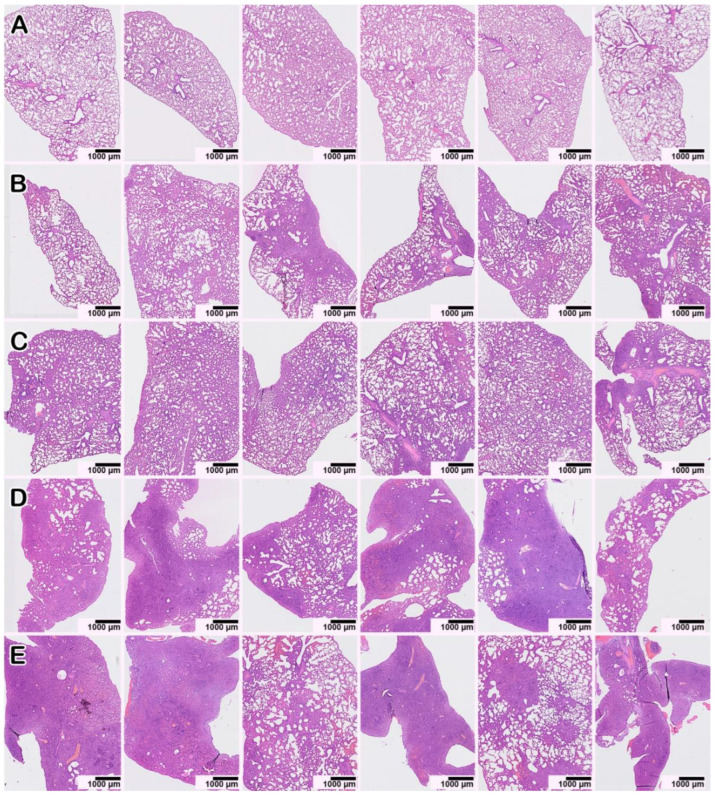
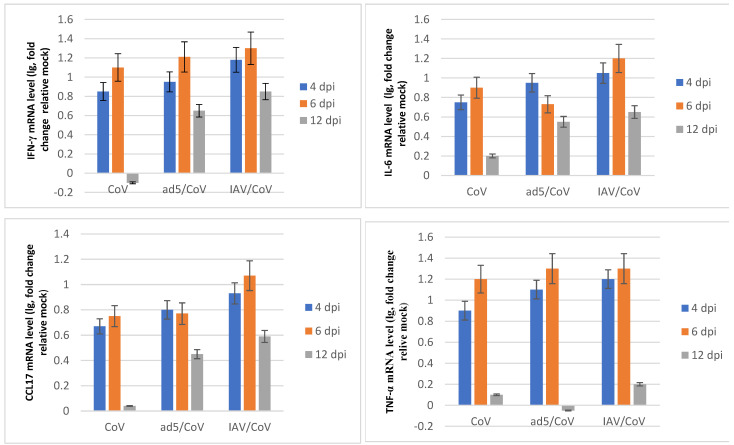
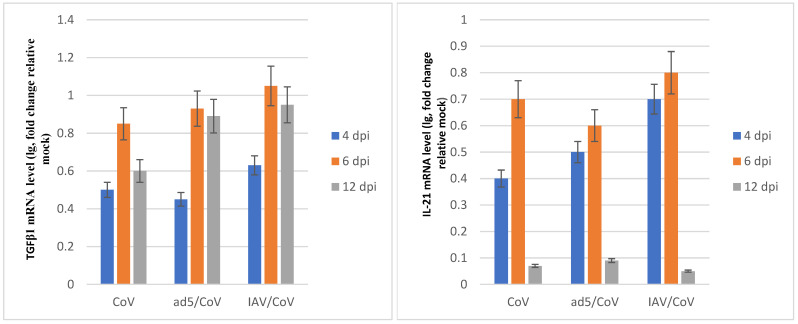
In this study, we investigated the features of the infectious process by simulating co-infection with SARS-CoV-2 and human adenovirus type 5 (HAdV-5) or influenza A virus (IAV) in vitro and in vivo. The determination of infectious activity of viruses and digital PCR demonstrated that during simultaneous and sequential HAdV-5 followed by SARS-CoV-2 infection in vitro and in vivo, the HAdV-5 infection does not interfere with replication of SARS-CoV-2. The hamsters co-infected and mono-infected with SARS-CoV-2 exhibited nearly identical viral titers and viral loads of SARS-CoV-2 in the lungs. The hamsters and ferrets co-infected by SARS-CoV-2- and IAV demonstrated more pronounced clinical manifestations than mono-infected animals. Additionally, the lung histological data illustrate that HAdV-5 or IAV and SARS-CoV-2 co-infection induces more severe pathological changes in the lungs than mono-infection. The expression of several genes specific to interferon and cytokine signaling pathways in the lungs of co-infected hamsters was more upregulated compared to single infected with SARS-CoV-2 animals. Thus, co-infection with HAdV-5 or IAV and SARS-CoV-2 leads to more severe pulmonary disease in animals.

Keywords: SARS-CoV-2; coinfection; ferret; hamster; human adenovirus 5; influenza A virus.


Conflict of interest statement

No authors report any conflict of interest. The funders had no role in the design of the study; in the collection, analyses, or interpretation of data; in the writing of the manuscript; or in the decision to publish the results.

Figures

Figure 1
Figure 1
Body weight changes in monoinfected and coinfected with HAdV-5 and SARS-CoV-2 Syrian hamsters. Body weight changes in monoinfected and coinfected with HAdV-5 and SARS-CoV-2 Syrian hamsters. “CoV (SARS-CoV-2)”—on Day 0, the Syrian hamsters were intranasally challenged with SARS-CoV-2 (105 TCID50); “ad (HAdV-5)/3-days/CoV”—on Day 0, the preinfected (3 days earlier) with HAdV-5 (106 TCID50) hamsters were intranasally challenged with SARS-CoV-2 (105 TCID50); “ad”—on Day 0, the Syrian hamsters were intranasally challenged with HAdV-5 (106 TCID50); “mock-infected”—on Day 0, the hamsters were intranasally inoculated wits PBS. n = 9 at 0 dpi to 4 dpi; n = 6 at 5 dpi to 6 dpi as 3 animals were sacrificed; n = 3 at 7 dpi to 12 dpi as 3 animals were sacrificed. The values represent the means ± SDs of individual animals. Student’s t-test was used for two-group comparisons, p < 0.05.
Figure 2
Figure 2
SARS-CoV-2 and HadV-5 replication in monoinfected and coinfected hamsters. (A) SARS-CoV-2 and HadV-5 viral infectious titers; (B) SARS-CoV-2 and HadV-5 viral genome loads. SARS-CoV-2—Syrian hamsters were intranasally challenged with SARS-CoV-2 (105 TCID50); SARS-CoV-2/HadV-5—Syrian hamsters were simultaneously intranasally challenged with SARS-CoV-2 (105 TCID50) and HadV-5 (106 TCID50); HadV-5/3-days/SARS-CoV-2—Syrian hamsters were intranasally challenged with HadV-5 (106 TCID50) and, 3 days later, with SARS-CoV-2 (105 TCID50); ad—Syrian hamsters were intranasally challenged with HadV-5 (106 TCID50). On Day 3 postinfection (for the ad/3 days/CoV group, this took place on Day 3 after the challenge with SARS-CoV-2), half of the lung tissues collected from hamsters were homogenized to determine the viral infectious titers and RNA/DNA genome loads. (A) The SARS-CoV-2 and HadV-5 titers, expressed as the 50% tissue culture infectious doses per gram (TCID50/g), were determined by the CPE assay in Vero E6 (Table S2) and HEK293A (Table S3) cells, respectively. (B) The lung homogenates were analyzed for viral genome loads by dPCR. The SARS-CoV-2 and HadV-5 genome loads were determined using primers targeting the 1ab and hexon genes, respectively. The values represent the means ± SDs of three hamsters. Student’s t-test was used for two-group comparisons, * p< 0.05.
Figure 3
Figure 3
SARS-CoV-2 and IAV replication in monoinfected and coinfected hamsters and ferrets. (A,C) SARS-CoV-2 viral genome loads were determined using qPCR for the 1ab gene in nasopharyngeal washes of hamsters and ferrets, respectively. (B,D) IAV viral genome loads were determined using qPCR for the M gene in nasopharyngeal washes of hamsters and ferrets, respectively. SARS-CoV-2—the Syrian hamsters and ferrets were intranasally challenged with SARS-CoV-2 (104 TCID50 and 3 × 10⁵ TCID50, respectively); IAV—the Syrian hamsters and ferrets were intranasally challenged with IAV (2 × 10³ TCID50 and 102 TCID50, respectively); IAV/SARS-CoV-2—the Syrian hamsters were intranasally challenged with IAV (2 × 10³ TCID50) and, 4 days later, with SARS-CoV-2 (104 TCID50); the ferrets were intranasally challenged with IAV (102 TCID50) and, 2 days later, with SARS-CoV-2 (3 × 10⁵ TCID50). On Days 6, 8, and 10 after infection with IAV for the hamsters and on Days 4, 6, and 8 after infection with IAV for the ferrets, nasopharyngeal washes were collected from all animals to determine the viral genome loads. The nasopharyngeal washes were analyzed by qPCR. The SARS-CoV-2 and IAV viral genome loads were determined using primers targeting the 1ab and M genes, respectively. The values represent the means ± SDs of three individual animals. Student’s t-test was used for two-group comparisons, * p < 0.05.
Figure 4
Figure 4
Body weight changes in monoinfected and coinfected with IAV and SARS-CoV-2 animals. (A) Body weight changes in monoinfected and coinfected with IAV and SARS-CoV-2 ferrets. “CoV (SARS-CoV-2)”—on Day 0, the ferrets were intranasally challenged with SARS-CoV-2 (3 × 10⁵ TCID50); “IAV”—on Day 0, the ferrets were intranasally challenged with IAV (102 TCID50); “IAV/CoV”—on Day 0, the ferrets preinfected (2 days earlier) with IAV (102 TCID50) were intranasally challenged with SARS-CoV-2 (3 × 10⁵ TCID50); “mock-infected”—on Day 0, the ferrets were intranasally inoculated with PBS. n = 4. (B) Body weight changes in monoinfected and coinfected with IAV and SARS-CoV-2 hamsters. “CoV SARS-CoV-2)”—on Day 0, the hamsters were intranasally challenged with SARS-CoV-2 (104 TCID50); “IAV”—on Day 0, the hamsters were intranasally challenged with IAV (2 × 10³ TCID50); “IAV/CoV”—on Day 0, the hamsters preinfected (4 days earlier) with IAV (2 × 10³ TCID50) were intranasally challenged with SARS-CoV-2 (104 TCID50); “mock-infected”—on Day 0, the hamsters were intranasally inoculated with PBS. n = 8 at 0 dpi to 6 dpi; n = 4 at 7 dpi to 12 dpi, as 4 animals were sacrificed. The values represent the means ± SDs of individual animals. Student’s t-test was used for two-group comparisons. * p < 0.05.
Figure 5
Figure 5
Histopathological alterations in hamster lungs monoinfected (HAdV-5, SARS-CoV-2, IAV) and coinfected with HAdV-5 and SARS-CoV-2. (A) mock-infected control animal, normal lung. (BE) Representative images showing pathological changes in lung tissue after infection: (B)—with HAdV-5; (C)—with HAdV-5 and SARS-CoV-2 simultaneously; (D)—with SARS-CoV-2; (E)—with HAdV-5 and, 3 days later, with SARS-CoV-2. In both cases of coinfection with two viruses (C,E), there was a significant increase in the consolidation zones and pronounced perifocal compensatory atelectasis. (F) Manifestations of adenovirus infection: edema and mixed inflammatory cell infiltration of the interalveolar septa and, in the upper part of the image, pronounced plethora of the capillaries. (GK) Typical pathological changes found in mixed infections. (G) Blood (black arrows), macrophages, and syncytium (white arrow) in the lumen of the alveoli and the activation and hyperplasia of type II pneumocytes. (H) Hemorrhage in the alveoli (black arrows). (I) Spasm of small vessels of the arterial type (black arrow); perivascular edema and perivascular lymphocytic infiltration (white arrow); desquamation of the epithelial lining of the bronchi (red arrow). (J) Destruction of the small bronchial wall (bronchiolitis, black arrow); desquamated bronchial epithelium in the lumen (red arrow); peribronchial and perivascular infiltration (white arrow). (K) Zone of consolidation of lung tissue with spasmodic arterioles (black arrow). (LN) Manifestations of IAV infection: epithelial cell degeneration, vasculitis, and perivascular lymphocyte infiltration, respectively (black arrows).
Figure 5
Figure 5
Histopathological alterations in hamster lungs monoinfected (HAdV-5, SARS-CoV-2, IAV) and coinfected with HAdV-5 and SARS-CoV-2. (A) mock-infected control animal, normal lung. (BE) Representative images showing pathological changes in lung tissue after infection: (B)—with HAdV-5; (C)—with HAdV-5 and SARS-CoV-2 simultaneously; (D)—with SARS-CoV-2; (E)—with HAdV-5 and, 3 days later, with SARS-CoV-2. In both cases of coinfection with two viruses (C,E), there was a significant increase in the consolidation zones and pronounced perifocal compensatory atelectasis. (F) Manifestations of adenovirus infection: edema and mixed inflammatory cell infiltration of the interalveolar septa and, in the upper part of the image, pronounced plethora of the capillaries. (GK) Typical pathological changes found in mixed infections. (G) Blood (black arrows), macrophages, and syncytium (white arrow) in the lumen of the alveoli and the activation and hyperplasia of type II pneumocytes. (H) Hemorrhage in the alveoli (black arrows). (I) Spasm of small vessels of the arterial type (black arrow); perivascular edema and perivascular lymphocytic infiltration (white arrow); desquamation of the epithelial lining of the bronchi (red arrow). (J) Destruction of the small bronchial wall (bronchiolitis, black arrow); desquamated bronchial epithelium in the lumen (red arrow); peribronchial and perivascular infiltration (white arrow). (K) Zone of consolidation of lung tissue with spasmodic arterioles (black arrow). (LN) Manifestations of IAV infection: epithelial cell degeneration, vasculitis, and perivascular lymphocyte infiltration, respectively (black arrows).
Figure 6
Figure 6
Pathological lesions in hamster lungs 10 days after monoinfection with IAV (B,C) or on Day 10 after infection with IAV and Day 6 after infection with SARS-CoV-2 for the case of coinfection (D,E). Each of the six survey images shows the lung tissue of one animal (the three on the left—the left lung; the three on the right—the right lung) to give a representative idea of the nature and prevalence of the pathology. (A) Mock-infected animal. (D,E) In double-infected animals, zones of dense consolidation of lung tissue caused by edema and cellular infiltration, mainly lymphocytic, spread to the entire anatomical lobe. Staining with hematoxylin–eosin. All images were taken using a 20× objective and are presented at the same scale. The scale bar is shown in the pictures.
Figure 7
Figure 7
The chemokine/cytokine profile in the lungs of hamsters coinfected with SARS-CoV-2 and HAdV-5 or IAV. “CoV (SARS-CoV-2)”—on Day 0, the hamsters were intranasally challenged with SARS-CoV-2 (105 TCID50); “ad5 (HAdV-5)/CoV”—on Day 0, the hamsters preinfected (3 days earlier) with HAdV-5 (106 TCID50) were intranasally challenged with SARS-CoV-2 (105 TCID50); IAV/CoV—on Day 0, the hamsters preinfected (4 days earlier) with IAV (2 × 10³ TCID50) were intranasally challenged with SARS-CoV-2 (104 TCID50); dpi—day postinfection with SARS-CoV-2. The data are expressed as fold changes relative to the mock-infected group. The values represent the means ± SDs of three individual animals. Student’s t-test was used for two-group comparisons, p < 0.05.
Figure 7
Figure 7
The chemokine/cytokine profile in the lungs of hamsters coinfected with SARS-CoV-2 and HAdV-5 or IAV. “CoV (SARS-CoV-2)”—on Day 0, the hamsters were intranasally challenged with SARS-CoV-2 (105 TCID50); “ad5 (HAdV-5)/CoV”—on Day 0, the hamsters preinfected (3 days earlier) with HAdV-5 (106 TCID50) were intranasally challenged with SARS-CoV-2 (105 TCID50); IAV/CoV—on Day 0, the hamsters preinfected (4 days earlier) with IAV (2 × 10³ TCID50) were intranasally challenged with SARS-CoV-2 (104 TCID50); dpi—day postinfection with SARS-CoV-2. The data are expressed as fold changes relative to the mock-infected group. The values represent the means ± SDs of three individual animals. Student’s t-test was used for two-group comparisons, p < 0.05.

References

    1. Wu F., Zhao S., Yu B., Chen Y.M., Wang W., Song Z.G., Hu Y., Tao Z., Tian J., Pei Y., et al. A new coronavirus associated with human respiratory disease in China. Nature. 2020;579:265–269. doi: 10.1038/s41586-020-2008-3. - DOI - PMC - PubMed
    1. Zhu N., Zhang D., Wang W., Li X., Yang B., Song J., Zhao X., Huang B., Shi W., Lu R., et al. A novel coronavirus from patients with pneumonia in China, 2019. N. Engl. J. Med. 2020;382:727–733. doi: 10.1056/NEJMoa2001017. - DOI - PMC - PubMed
    1. Wang C., Horby P.W., Hayden F.G., Gao G.F. A novel coronavirus outbreak of global health concern. Lancet. 2020;395:470–473. doi: 10.1016/S0140-6736(20)30185-9. - DOI - PMC - PubMed
    1. Wang M., Wu Q., Xu W., Qiao B., Wang J., Zheng H., Jiang S., Mei J., Wu Z., Deng Y., et al. Clinical diagnosis of 8274 samples with 2019-novel coronavirus in Wuhan. medRxiv. 2020 doi: 10.1101/2020.02.12.20022327. - DOI
    1. Kim D., Quinn J., Pinsky B., Shah N.H., Brown I. Rates of co-infection between SARS-CoV-2 and other respiratory pathogens. Jama. 2020;323:2085–2086. doi: 10.1001/jama.2020.6266. - DOI - PMC - PubMed

LinkOut - more resources