. 2023 Jan 5;28(2):558.
doi: 10.3390/molecules28020558.

Xanthomicrol Activity in Cancer HeLa Cells: Comparison with Other Natural Methoxylated Flavones

Affiliations

Xanthomicrol Activity in Cancer HeLa Cells: Comparison with Other Natural Methoxylated Flavones

Mariella Nieddu et al. Molecules. .

Abstract

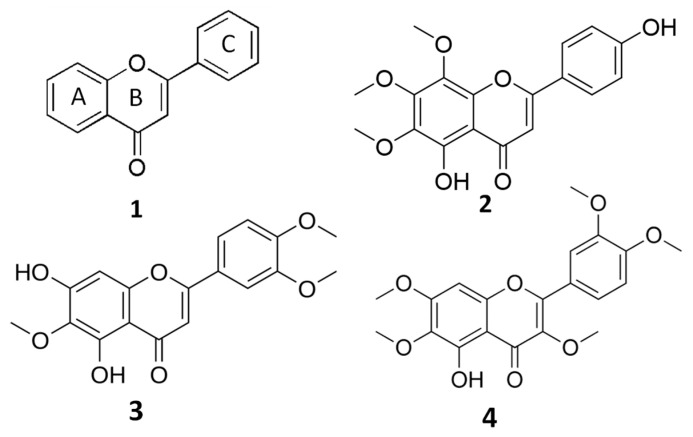
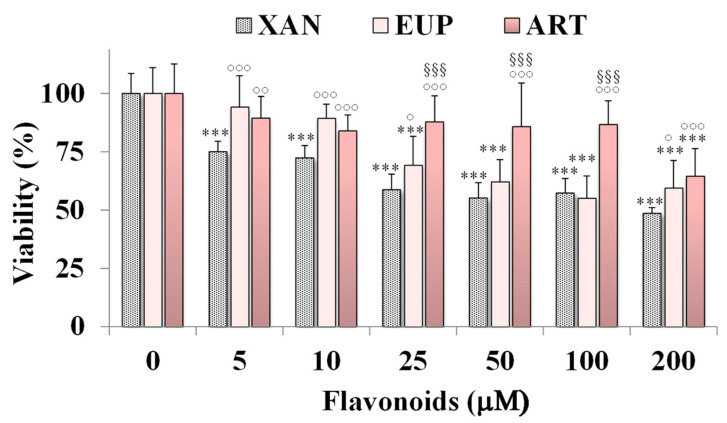
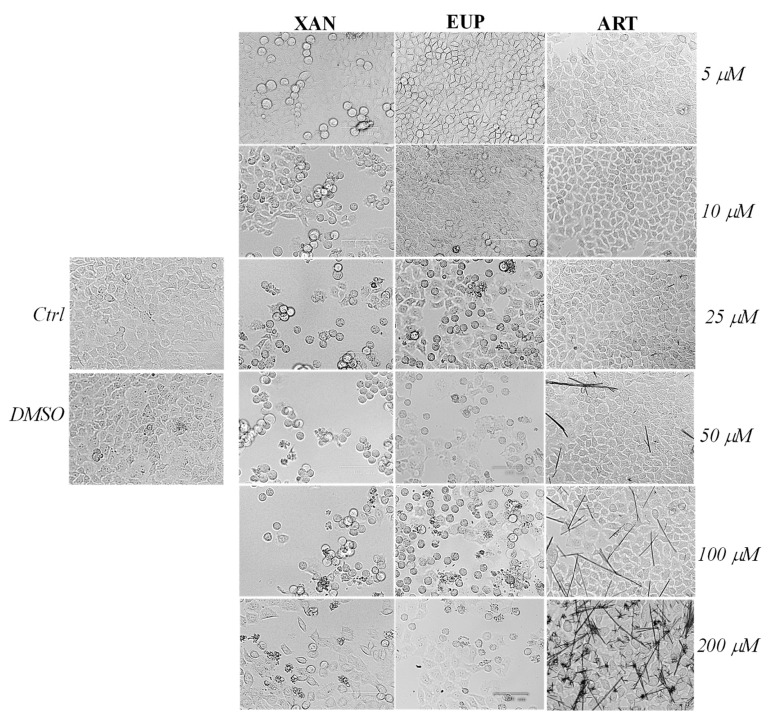
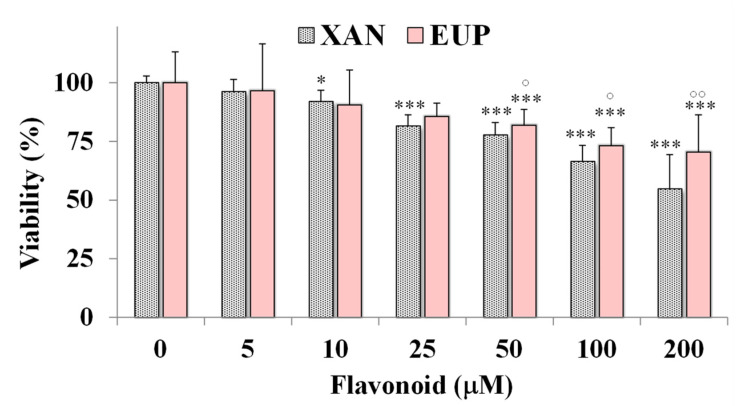
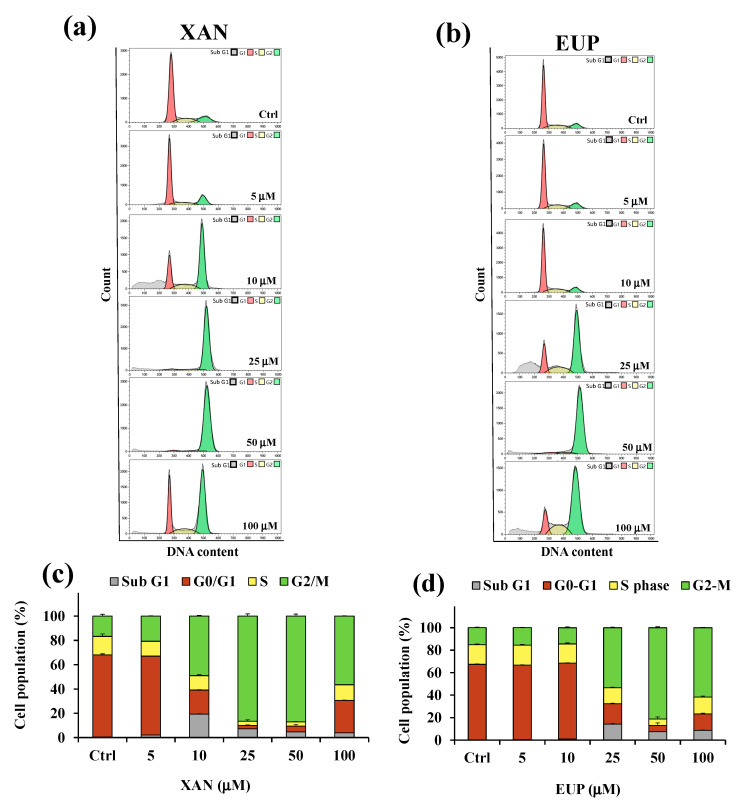
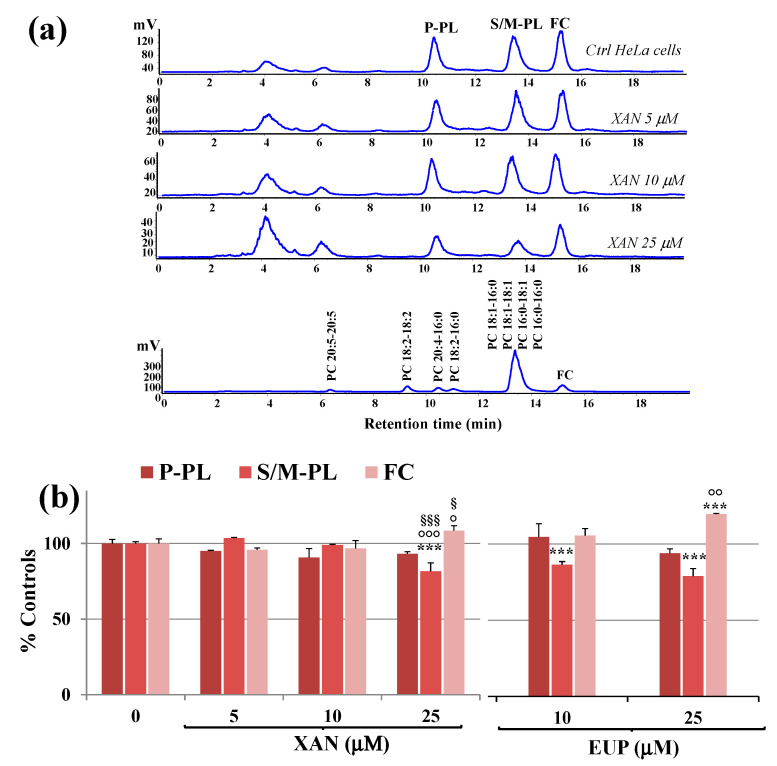
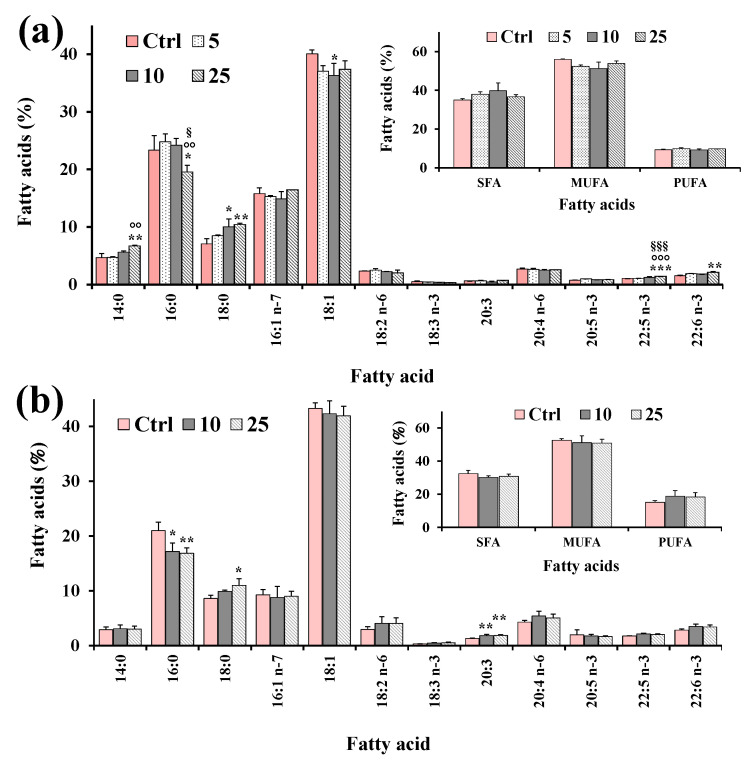
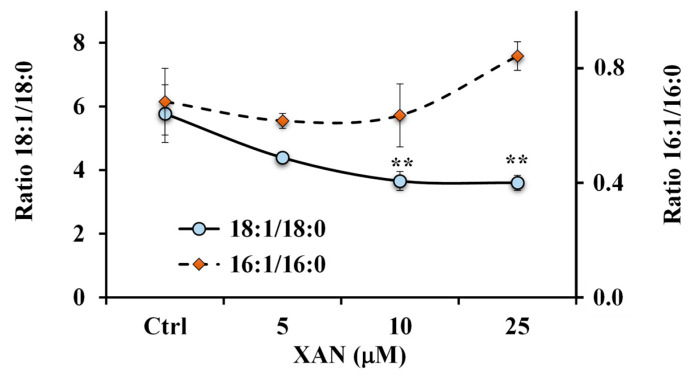
The methoxylated flavone xanthomicrol represents an uncommon active phenolic compound identified in herbs/plants with a long application in traditional medicine. It was isolated from a sample of Achillea erba-rotta subsp. moschata (musk yar-row) flowering tops. Xanthomicrol promising biological properties include antioxidant, anti-inflammatory, antimicrobial, and anticancer activities. This study mainly focused on the evaluation of the xanthomicrol impact on lipid metabolism in cancer HeLa cells, together with the investigation of the treatment-induced changes in cell growth, morphology, and apoptosis. At the dose range of 5-100 μM, xanthomicrol (24 h of incubation) significantly reduced viability and modulated lipid profile in cancer Hela cells. It induced marked changes in the phospholipid/cholesterol ratio, significant decreases in the levels of oleic and palmitic acids, and a marked increase of stearic acid, involving an inhibitory effect on de novo lipogenesis and desaturation in cancer cells. Moreover, marked cell morphological alterations, signs of apoptosis, and cell cycle arrest at the G2/M phase were observed in cancer treated cells. The bioactivity profile of xanthomicrol was compared to that of the anticancer methoxylated flavones eupatilin and artemetin, and structure-activity relationships were underlined.

Keywords: cancer cells; cell cycle; cytotoxicity; lipids; natural flavones; xanthomicrol.


Conflict of interest statement

The authors declare no conflict of interest.

Figures

Figure 1
Figure 1
General structure of flavones (1) and chemical structures of xanthomicrol (XAN, (2)), eupatilin (EUP, (3)) and artemetin (ART, (4)).
Figure 2
Figure 2
Viability, expressed as % of the control (0), induced by incubation for 24 h with different amounts (5–200 μM) of xanthomicrol (XAN), eupatilin (EUP), and artemetin (ART) in cancer HeLa cells (MTT assay). Three independent experiments are performed, and data are presented as mean and SD (n = 15). For each series: *** = p < 0.001 versus Ctrl. For each concentration group: °°° = p < 0.001, °° = p < 0.01, ° = p < 0.05 versus XAN-treated cells; §§§ = p < 0.001 versus EUP-treated cells. Statistical significance of differences was assessed by One-way ANOVA and Bonferroni post Test.
Figure 3
Figure 3
The panel shows representative images of phase contrast of control HeLa cells and cells treated for 24 h with xanthomicrol (XAN), eupatilin (EUP), and artemetin (ART) at 5–200 μM. Bar = 100 μm.
Figure 4
Figure 4
Viability, expressed as % of the control (0), induced by incubation for 24 h with different amounts (5–200 μM) of xanthomicrol (XAN) and eupatilin (EUP) in murine 3T3 fibroblasts (MTT assay). Three independent experiments are performed, and data are presented as mean and SD (n = 15). For each series: *** = p < 0.001, * = p < 0.05 versus respective controls (One-way ANOVA and Bonferroni post Test). For each concentration group: °° = p < 0.01, ° = p < 0.05 for EUP-treated cells versus XAN-treated cells (Student’s unpaired t-test with Welch’s correction).
Figure 5
Figure 5
Flow cytometric analysis of the cell cycle distribution determined in control HeLa cells (Ctrl) and cells treated for 24 h with xanthomicrol (XAN) (a) and eupatilin (EUP) (b) at the concentration range of 5–100 μM. Percentage values of the HeLa cells in cell cycle patterns (sub G1, G0/G1, S, and G2/M phases) determined for XAN (c) and EUP (d). Three independent experiments are performed, and data are presented as mean and SD (n = 3).
Figure 6
Figure 6
(a) Chromatographic profile obtained by HPLC-ELSD analysis at 0.7 mL/min of polyunsaturated phospholipids (P-PL), saturated/monounsaturated phospholipids (S/M–PL), and free cholesterol (FC), measured in control HeLa cells (0) and cells treated for 24 h with different amounts (5, 10 and 25 μM) of xanthomicrol (XAN). A standard mixture of saturated/monounsaturated (mix PL: PC 16:0/16:0, PC 18:1/18:1, PC 16:0/18:1, PC 18:1/16:0) and polyunsaturated phosphatidylcholines (PC 16:0/18:2, PC 16:0/20:4, PC 18:2/18:2; PC 20:5/20:5) were used to assign the chromatographic region for each lipid class. (b) Values (% controls) of PL and FC measured in control and HeLa cells treated with XAN (5, 10 and 25 μM) and the reference compound eupatilin (EUP) (10 and 25 μM) [6]. Three independent experiments are performed, and data are presented as mean ± standard deviation (SD) (n = 6). For each series: *** = p < 0.001 versus Ctrl; °°° = p < 0.001, °° = p < 0.01, ° = p < 0.05 versus cells treated with XAN 5 μM; §§§ = p < 0.001, § = p < 0.05 versus cells treated with XAN 10 μM. Statistical significance of differences was assessed by One-way ANOVA and Bonferroni post Test.
Figure 7
Figure 7
Values (expressed as % of total fatty acids) of the main fatty acids, total saturated (SFA), monounsaturated (MUFA) and polyunsaturated (PUFA) fatty acids measured in control HeLa cells (Ctrl) and cells treated for 24 h with XAN (5, 10 and 25 μM) (a) and the reference compound eupatilin (EUP) (10 and 25 μM) [6] (b). Three independent experiments and two replicates for each condition are performed, and data are presented as mean ± SD (n = 6). *** = p < 0.001, ** = p < 0.01, * = p < 0.05 versus Ctrl; °°° = p < 0.001, °° = p < 0.01 versus cells treated with XAN 5 μM; §§§ = p < 0.001, § = p < 0.05 versus cells treated with XAN 10 μM. Statistical significance of differences was assessed by One-way ANOVA and Bonferroni post Test.
Figure 8
Figure 8
Values of the ratios 18:1 n-9/18:0 and 16:1 n-7/16:0 measured in control HeLa cells and cells treated for 24 h with different amounts (5, 10 and 25 μM) of xanthomicrol (XAN). ** = p < 0.01 versus Ctrl. Statistical significance of differences was assessed by One-way ANOVA and Bonferroni post Test.

References

    1. Wang T.Y., Li Q., Bi K.S. Bioactive flavonoids in medicinal plants: Structure, activity and biological fate. Asian J. Pharm. Sci. 2018;13:12–23. doi: 10.1016/j.ajps.2017.08.004. - DOI - PMC - PubMed
    1. Kumar S., Pandey A.K. Chemistry and biological activities of flavonoids: An overview. Sci. World J. 2013;29:162750. doi: 10.1155/2013/162750. - DOI - PMC - PubMed
    1. Rosa A., Isola R., Pollastro F., Nieddu M. Effect of the natural polymethoxylated flavone artemetin on lipid oxidation and its impact on cancer cell viability and lipids. Fitoterapia. 2022;156:105102. doi: 10.1016/j.fitote.2021.105102. - DOI - PubMed
    1. Kopustinskiene D.M., Jakstas V., Savickas A., Bernatoniene J. Flavonoids as anticancer agents. Nutrients. 2020;12:457. doi: 10.3390/nu12020457. - DOI - PMC - PubMed
    1. Rodriguez-Garcia C., Sanchez-Quesada C. Dietary flavonoids as cancer chemopreventive: An updated review of human studies. Antioxidants. 2019;8:137. doi: 10.3390/antiox8050137. - DOI - PMC - PubMed