. 2023 Jan 7;15(2):303.
doi: 10.3390/nu15020303.

Resting Energy Expenditure in the Critically Ill and Healthy Elderly-A Retrospective Matched Cohort Study

Affiliations

Resting Energy Expenditure in the Critically Ill and Healthy Elderly-A Retrospective Matched Cohort Study

Matthias Lindner et al. Nutrients. .

Abstract

The use of indirect calorimetry to measure resting energy expenditure (mREE) is widely recommended as opposed to calculating REE (cREE) by predictive equations (PE). The aim of this study was to compare mREE with cREE in critically ill, mechanically ventilated patients aged ≥ 75 years and a healthy control group matched by age, gender and body mass index. The primary outcome was the PE accuracy rate of mREE/cREE, derived using Bland Altman plots. Secondary analyses included linear regression analyses for determinants of intraindividual mREE/cREE differences in the critically ill and interindividual mREE differences in the matched healthy cohort. In this retrospective study, 90 critically ill patients (median age 80 years) and 58 matched healthy persons were included. Median mREE was significantly higher in the critically ill (1457 kcal/d) versus the healthy cohort (1351 kcal/d), with low PE accuracy rates (21% to 49%). Independent predictors of mREE/cREE differences in the critically ill were body temperature, heart rate, FiO2, hematocrit, serum sodium and urea. Body temperature, respiratory rate, and FiO2 were independent predictors of interindividual mREE differences (critically ill versus healthy control). In conclusion, the commonly used PE in the elderly critically ill are inaccurate. Respiratory, metabolic and energy homeostasis variables may explain intraindividual mREE/cREE as well as interindividual mREE differences.

Keywords: calorie intake; critical care; elderly; indirect calorimetry; medical nutrition therapy; resting energy expenditure.


Conflict of interest statement

GE reported having received lecture fees and advisory honoraria from Fresenius Kabi. All other authors declare no conflict of interest.

Figures
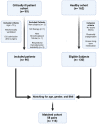
Figure 1
Figure 1
Study flow chart illustrating inclusion and matching process. The critically ill patient cohort comprised of N = 90 patients. For the matched cohort, N = 58 critically ill patients were matched by age, gender and BMI with subjects from the healthy cohort. Abbreviations. ICU: intensive care unit, NO: nitric oxide, BMI: body mass index.
Figure 2
Figure 2
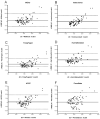
Bland–Altman analyses of measured and calculated resting energy expenditure in the critically ill patient cohort. The difference between the measured and calculated REE (y axis) is plotted against the mean of REE (x axis), with each data point corresponding to one patient for the following equations: (A) Müller, (B) Ireton-Jones and Jones, (C) FaisyFagon, (D) Harris and Benedict (E) ACCP, and (F) PennState. Abbreviations. REE: resting energy expenditure, kcal: kilocalories, d: day.
Figure 3
Figure 3
Variables independently associated with differences between estimated and measured resting energy expenditure in the critically ill patient cohort. Predictive equations developed for healthy persons are shown at the upper left side, and predictive equations developed for critically ill patients are shown on the upper right side of each panel. Panel (A) depicts respiratory (blue and purple), Panel (B,C) laboratory (red, dark blue, green, black), and Panel (D) circulatory and energy homeostasis variables (brown and yellow). The extent to which each variable explains differences between the two measurement methods (corresponding to change in R2 from Table 3) is represented by thinner or thicker arrows pointing to the respective predictive equation. For example, the duration of MV explains 26.6% (R2 of 0.226) of differences between measured resting energy expenditure and estimated resting energy expenditure using the equation of Müller (thicker purple arrow pointing to Müller), but only 7.9% (R2 of 0.079) of differences between measured resting energy expenditure and estimated resting energy expenditure using the PennState equation (thinner purple arrow pointing to PennState). Abbreviations: FiO2: Fraction of inspired oxygen; MV: mechanical ventilation; sodium: serum sodium concentration.

References

    1. Orimo H. Reviewing the definition of elderly. Nihon Ronen Igakkai Zasshi. 2006;43:27–34. doi: 10.3143/geriatrics.43.27. - DOI - PubMed
    1. Sjoding M.W., Prescott H.C., Wunsch H., Iwashyna T.J., Cooke C.R. Longitudinal Changes in ICU Admissions Among Elderly Patients in the United States. Crit. Care Med. 2016;44:1353–1360. doi: 10.1097/CCM.0000000000001664. - DOI - PMC - PubMed
    1. Bagshaw S.M., Webb S.A., Delaney A., George C., Pilcher D., Hart G.K., Bellomo R. Very old patients admitted to intensive care in Australia and New Zealand: A multi-centre cohort analysis. Crit. Care. 2009;13:R45. doi: 10.1186/cc7768. - DOI - PMC - PubMed
    1. Phua J., Weng L., Ling L., Egi M., Lim C.M., Divatia J.V., Shrestha B.R., Arabi Y.M., Ng J., Gomersall C.D., et al. Intensive care management of coronavirus disease 2019 (COVID-19): Challenges and recommendations. Lancet Respir. Med. 2020;8:506–517. doi: 10.1016/S2213-2600(20)30161-2. - DOI - PMC - PubMed
    1. Lew C.C.H., Yandell R., Fraser R.J.L., Chua A.P., Chong M.F.F., Miller M. Association Between Malnutrition and Clinical Outcomes in the Intensive Care Unit: A Systematic Review [Formula: See text] JPEN J. Parenter. Enteral Nutr. 2017;41:744–758. doi: 10.1177/0148607115625638. - DOI - PubMed

LinkOut - more resources